

Introduction
Materials and Methods
Fruit Material
Ethylene Treatment and Cold Storage
Physiochemical Measurements
Results and Discussion
Soluble Solids Content (SSC)
Titratable Acidity (TA)
SSC/TA Ratio
Flesh and Core Firmness
Organic Acids
Conclusions
Introduction
In Korea, kiwifruit (Actinidia sp.) cultivation was initiated in 1978 and is mostly cultivated in the southeast region (Park et al., 2006; Kwack and Park, 2007; Kwack et al., 2017). Green-fleshed kiwifruit (Actinidia deliciosa) and yellow-/red-fleshed kiwifruit (Actinidia chinensis) are the most commercialized kiwifruit species worldwide (Kim et al., 2009). ‘Hayward’, ‘Garmrok’, ‘Jecy Green’, ‘Jecy Sweet’, and ‘Green King’ are some commercially grown green-fleshed kiwifruit cultivars in Korea, whereas ‘Jecy Gold’, ‘Goldone’, and ‘Sweet Gold’ are a few yellow-fleshed kiwifruit cultivars grown in Korea (Kwack and Park, 2007; Kwack et al., 2017).
Kiwifruit is classified as a climacteric fruit and the ripening process is affected by the rate of ethylene production (Park et al., 2006; Yang and Lim, 2017a, Yang and Lim, 2017b). Commercially, kiwifruit is harvested at physiological maturity but in an unripe state. At harvest, kiwifruit has a negligible ethylene content and this endogenous ethylene content is not enough to induce the ripening of kiwifruit (Park et al., 2006). Therefore, it is necessary to use exogenous ethylene treatment. Exogenous ethylene treatment increased endogenous ethylene production in kiwifruit by enhancing the activity of two enzymes involved in ethylene synthesis, i.e., 1-aminocyclopropane-1-carboxylic acid (ACC) synthase (ACS) and ACC oxidase (ACO) and characterized by a period of autocatalytic ethylene production, a well-known phenomenon in climacteric fruits (Park et al., 2006; Yang and Lim, 2017a, Yang and Lim, 2017b).
Low temperature is a critical factor in maintaining quality and extending the shelf-life of fruit and vegetables after harvest. The ripening process occurs slowly during storage at low temperature. Low temperature storage can reduce most cell metabolic activities such as respiration and ethylene production, as well as inhibit microbial growth and retard spoilage, thus slowing the changes related to ripening and senescence, resulting in higher quality and prolonging postharvest life (Yang and Lim, 2017a, Yang and Lim, 2017b). Moreover, consumers prefer to purchase “ready to eat” kiwifruit that are near the fully ripened stage. The storage temperature greatly influences the rate of fruit ripening. Year-round production and supply of kiwifruit throughout the postharvest chain is determined by the cold storage process (Shahkoomahally and Ramezanian, 2015). Furthermore, ethylene production in kiwifruit is almost zero at temperatures below 10°C and the expression patterns of ethylene synthesis-, ethylene receptors-, and ripening-related genes are greatly influenced at low temperature (Yang and Lim, 2017b). The ideal storage conditions for kiwifruit also depend on the variety, harvest time, region, orchard location, and cultivation conditions (Yang and Lim, 2017a, Yang and Lim, 2017b). In this study, we evaluated the influence of storage temperature on ripening and physiochemical changes, i.e., soluble solids content (SSC), titratable acidity (TA), the SSC/TA ratio, firmness, and organic acids content, in kiwifruit cultivars ‘Garmrok’, ‘Hayward’, ‘Goldone’, and ‘Jecy Gold’ treated with exogenous ethylene to optimize the kiwifruit storage temperature.
Materials and Methods
Fruit Material
The experiment was carried out on two different kiwifruit species, Actinidia deliciosa and Actinidia chinensis, including three Korean cultivars, A. deliciosa ‘Garmrok’, A. chinensis ‘Goldone’, and A. chinensis ‘Jecy Gold’, and one New Zealand cultivar, A. deliciosa ‘Hayward’. All kiwifruit were harvested at 160 - 180 days after full bloom from vines growing at a commercial orchard in Sachun, Korea. After harvest, all samples were immediately transferred to the Laboratory of Fruit Science, Gyeongsang National University, Korea.
Ethylene Treatment and Cold Storage
A total of 210 evenly-sized kiwifruit without wounds or mechanical damage were randomly selected from each cultivar and subjected to exogenous ethylene treatment for enhancing ripening. A. deliciosa ‘Garmrok’ and A. deliciosa ‘Hayward’ kiwifruit were exposed to ethylene at a concentration of 1,000 µL·L-1 for 24 h at 20°C, while A. chinensis ‘Goldone’ and A. chinensis ‘Jecy Gold’ kiwifruit were exposed to ethylene at a concentration of 100 µL·L-1 for 24 h at 20°C. The 1,000 µL·L-1 and 100 µL·L-1 concentrations of ethylene were applied based on our previous experiments, which found that optimum ripening of the selected kiwifruit occurs at the above concentrations (Shin, 2018; Shin et al., 2019). Ethylene- treated kiwifruit were stored at three different temperatures, low (5°C), medium (10°C), and high (18°C), for 0, 3, 6, 9, 12, 15, and 18 days.
Physiochemical Measurements
Soluble Solids Content (SSC)
SSC was assayed in 10 biological replicates. The peeled fruit was wrapped in a four-layer cheese cloth, squeezed, and the absorbance of the juice was read using a hand refractometer (Pocket Refractometer, PAL-1, Atago Co., Ltd., Tokyo, Japan) and was expressed in percentage.
Titratable Acidity (TA)
TA was assayed by titrating the extracted juice with 0.1 mol·L-1 NaOH to an endpoint of pH 8.3 using a professional benchtop BP3001 pH meter (Trans Instruments, Singapore). TA was measured in a combined extract obtained from 10 fruits. The results were recalculated and presented as anhydrous citric acid equilibrium and expressed in percentage.
Firmness
Kiwifruit firmness (core and flesh firmness) was measured on 10 fruits using a rheometer (RHEO TEX SD-700, Sun Scientific Inc, Japan) fitted with an 8 mm round flat probe. Each fruit was compressed 3 mm at the crosshead speed of 120 mm·min−1 at room temperature (20 ± 2°C) and the maximum force developed during the test was recorded and expressed in Newton (N).
Organic Acids
Organic acids were analyzed according to the method described by Kim et al. (2009) with slight modifications. A 5 g of pooled flesh sample (five fruit each) was homogenized with 10 mL of distilled water and boiled for 15 min. After cooling the homogenate to room temperature, the volume was brought up to 25 mL with distilled water. The suspension was centrifuged at 18,000 × g for 30 min at 10°C. The supernatant was vacuum filtered through a 0.45 µm membrane filter and 15 mL of supernatant was brought up to 30 mL with 0.5% potassium dihydrogenphosphate (KH2PO4) buffer (pH 2.4), which was then again filtered through a 0.45 µm membrane filter before being added into HPLC vials. An aliquot of 5 µL was analyzed by HPLC (Agilent 1200 Chemstation, Agilent, CA, USA) using a 250 mm × 4.6 mm i.d. Develosil RPAQUEOUS-AR-3 column (Nomura Chemical Co., Ltd, Seto, Japan) and eluted with 0.5% (w/v) KH2PO4 buffered with phosphoric acid (pH 2.4). The flow rate was 0.7 mL·min-1 and the column temperature was set at 25°C. Peaks were identified at 214 nm with a UV/VIS detector (1200 Variable Wavelength Detector, Agilent, CA, USA). Organic acids were identified by the retention time in the chromatogram compared to the standards and the results were expressed in mg/100 g on a fresh weight basis.
Statistical Analysis
The experiment was conducted in a completely randomized design separately for each cultivar. The data were subjected to analysis of variance (ANOVA) using the statistical analysis software (SAS, version 9.4, SAS Institute Inc., Cary, NC, USA). Duncan’s test was applied at the significance level of p < 0.05 for each cultivar separately to evaluate the significance of differences between mean values for three different temperatures, low (5°C), medium (10°C), and high (18°C), for 0, 3, 6, 9, 12, 15, and 18 storage days. Graphics were created using SigmaPlot v12.0 (Systat Software, Inc. SigmaPlot for Windows, USA).
Results and Discussion
Soluble Solids Content (SSC)
The SSC is associated with the eating quality of ripe fruit and is used as a maturity index in quality measurements. Changes in the SSC of kiwifruit are presented in Fig. 1A-1D. At harvest, the SSC was 12.0 and 8.6% for ‘Garmrok’ and ‘Hayward’ kiwifruit, respectively, and was 10.5% for both ‘Goldone’ and ‘Jecy Gold’ kiwifruit.
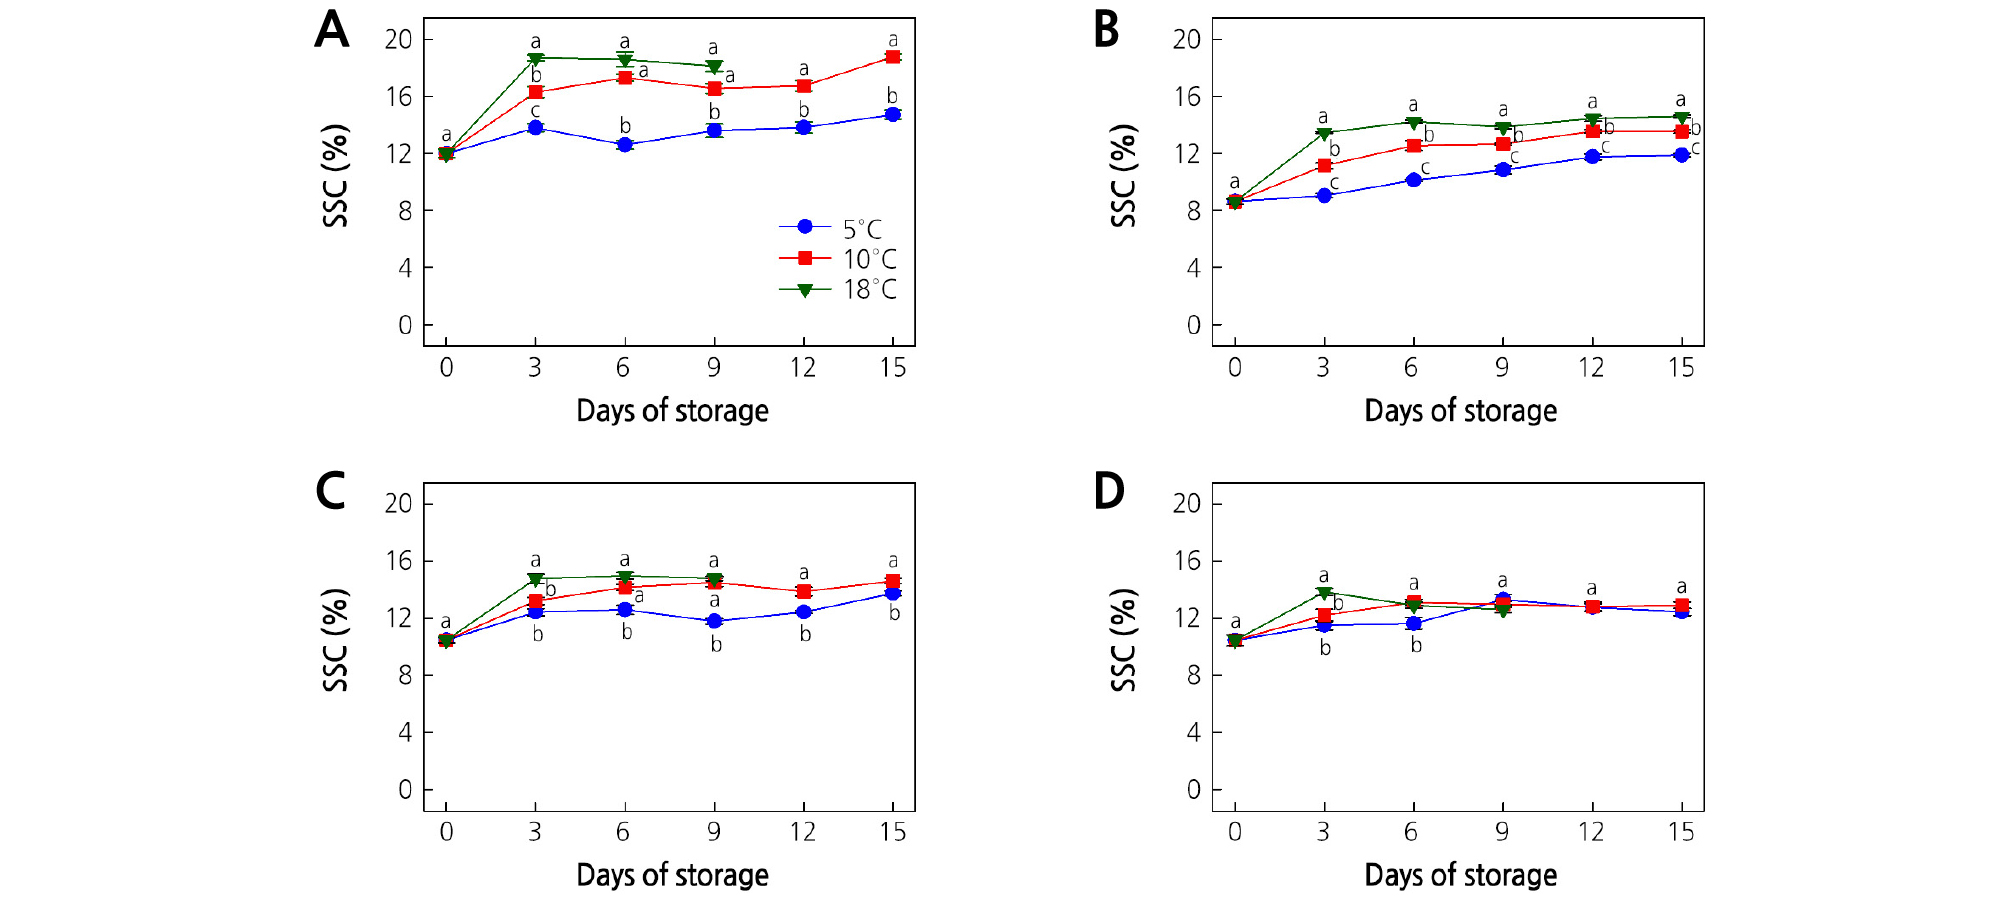
Fig. 1.
Effect of storage temperature on the soluble solids content (SSC) of (A) ‘Garmrok’, (B) ‘Hayward’, (C) ‘Goldone’, and (D) ‘Jecy Gold’ kiwifruit. Vertical bars indicate SE (n = 10). The same letters for each storage temperature describe means which do not differ significantly at p < 0.05 according to Duncan’s test, as analyzed by statistical analysis software (SAS).
In ‘Garmrok’ kiwifruit at 3 days of storage (DOS), the SSC was significantly higher (p < 0.05) at 18°C (18.7%), followed by 10°C (16.3%), and 5°C (13.8%) (Fig. 1A). Thereafter until the end of the storage period, significantly low (p < 0.05) SSC values were recorded in kiwifruit at 5°C compared to the other two temperatures. The kiwifruit SSC values at 10 and 18°C were not significantly different (p > 0.05) from 6 DOS up to the end of the storage period. Hence, the sweetness of ‘Garmrok’ kiwifruit stored at 10 and 18°C might be similar after 6 DOS during ripening. A similar trend was also observed by Park and Kim (2015) for A. arguta kiwifruit after 4 and 8 DOS at 15 and 20°C. At 15 DOS, the SSC reached 14.7 and 18.8% in ‘Garmrok’ kiwifruit stored at 5 and 10°C, respectively. The SSC of ‘Garmrok’ kiwifruit stored at 18°C reached 18.1% at 9 DOS. Hence, the increase in SSC was more rapid at higher storage temperatures. The SSC increased from 8.6% to 11.9, 13.5, and 14.6% at 15 DOS in ‘Hayward’ kiwifruit stored at 5, 10, and 18°C, respectively (Fig. 1B). Significantly low (p < 0.05) SSC values were recorded for ‘Hayward’ kiwifruit stored at 5°C when compared to 10 and 18°C.
Significantly lower (p < 0.05) SSC values were recorded in ‘Goldone’ kiwifruit at 5°C, compared to 10 and 18°C (Fig. 1C). At 3 DOS, the SSC was significantly higher (p < 0.05) in kiwifruit at 18°C (14.8%), followed by 10°C (13.2%), and 5°C (12.4%), which were not significantly different (p > 0.05). After 3 DOS, the SSC of ‘Goldone’ kiwifruit did not differ significantly (p > 0.05) between 10 and 18°C until the end of the storage period. Hence, the sweetness of ‘Goldone’ kiwifruit stored at 10 and 18°C might be similar after 3 DOS during ripening. At 15 DOS, the SSC reached 13.8 and 14.6% in ‘Goldone’ kiwifruit stored at 5 and 10°C, respectively. However, the SSC of ‘Goldone’ kiwifruit stored at 18°C reached 14.8% at 9 DOS.
At 3 DOS, the SSC of ‘Jecy Gold’ kiwifruit at 18°C was significantly higher (13.9%) (p < 0.05), followed by 10°C (12.2%), and 5°C (11.5%), which were not significantly different (p > 0.05) (Fig. 1D). Further, at 6 DOS, the SSC was significantly higher (p < 0.05) in kiwifruit at 18°C (12.9%) and 10°C (13.1%), when compared to 5°C (11.6%). Thereafter until the end of the storage period, the SSC was not significantly different (p > 0.05) at all three storage temperatures. Hence, the sweetness of ‘Jecy Gold’ kiwifruit stored at 5, 10, and 18°C might be similar after 6 DOS during ripening. At 15 DOS, the SSC reached 12.5 and 12.9% in ‘Jecy Gold’ kiwifruit stored at 5 and 10°C, respectively. The SSC of ‘Jecy Gold’ kiwifruit stored at 18°C reached 12.6% at 9 DOS.
The highest SSC was detected from green-fleshed ‘Garmrok’, followed by yellow-fleshed ‘Goldone’. The yellow-fleshed ‘Jecy Gold’ kiwifruit had the lowest SSC, followed by green-fleshed ‘Hayward’. The SSC tended to increase during kiwifruit ripening, but the rate of increase of the SSC varied depending on the cultivar, storage temperature, and storage time. Our results revealed that the SSC increased more rapidly during kiwifruit ripening at higher storage temperatures and confirmed the findings of Park and Kim (2015). Others have also found a significant increase in SSC during kiwifruit ripening during cold storage (Park et al., 2006; Zolfaghari et al., 2010; Shahkoomahally and Ramezanian, 2015; Shiri et al., 2016).
The increase in SSC during ripening could be attributed to the breakdown of carbohydrates into simple sugars (Park and Kim, 2015; Shahkoomahally and Ramezanian, 2015; Shiri et al., 2016; Yang and Lim, 2017a). At higher temperatures, the conversion of complex carbohydrates into simpler sugars is accelerated, which results in a high SSC and rapid ripening, whereas at low temperatures, ripening is delayed and the hydrolysis of carbohydrates is slower, resulting in a low SSC. Consequently, kiwifruit stored at 5ºC had the lowest SSC.
Titratable Acidity (TA)
TA is an important factor that is reflected in the fruit storage characteristics and fruit quality. A pronounced reduction in TA induces faster senescence of fruit (Shahkoomahally and Ramezanian, 2015; Shiri et al., 2016). A reduction of TA was observed during cold storage (Fig. 2A-2D). At harvest, TA was 1.3, 2.0, 1.5, and 1.4% for ‘Garmrok’, ‘Hayward’, ‘Goldone’, and ‘Jecy Gold’ kiwifruit, respectively. The TA reduction rate was more pronounced with the increase in storage temperature. For all kiwifruit cultivars, significantly low TA values (p < 0.05) were recorded at 18°C, while the significantly highest TA values (p < 0.05) were recorded at 5°C.
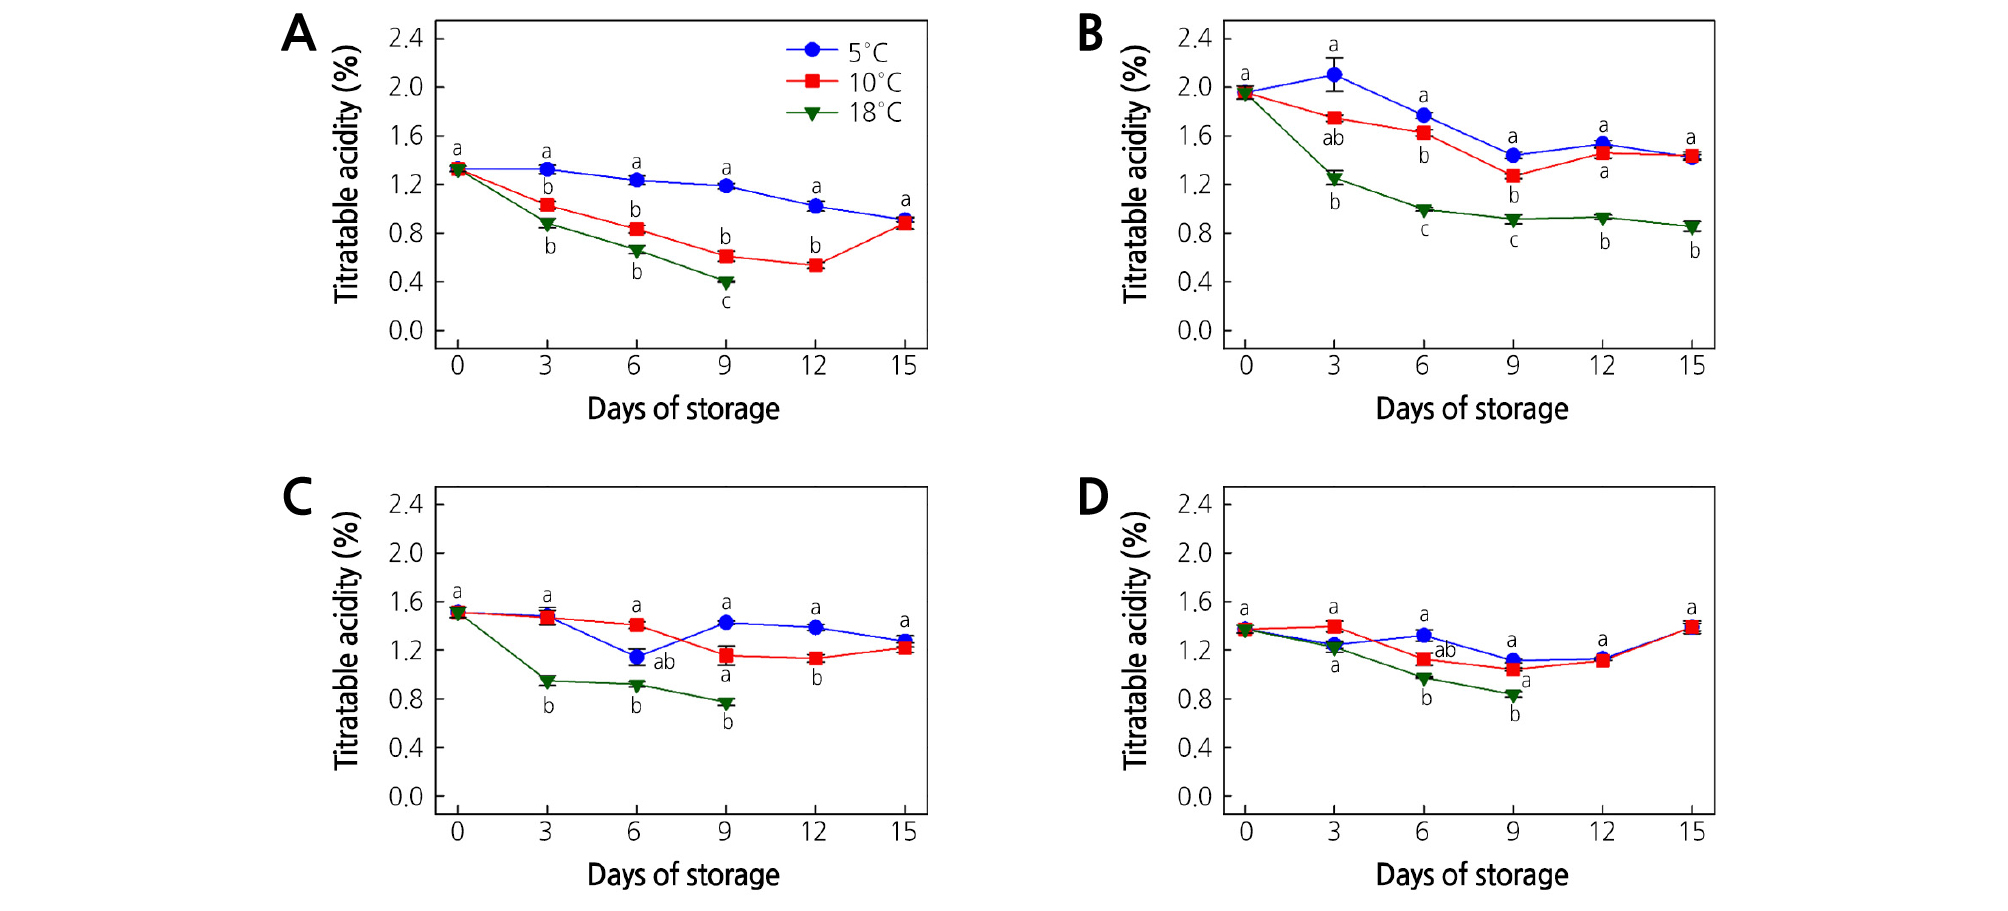
Fig. 2.
Effect of storage temperature on titratable acidity (TA) of (A) ‘Garmrok’, (B) ‘Hayward’, (C) ‘Goldone’, and (D) ‘Jecy Gold’ kiwifruit. Vertical bars indicate SE (n = 10). The same letters for each storage temperature describe means which do not differ significantly at p < 0.05 according to Duncan’s test, as analyzed by statistical analysis software (SAS).
In ‘Garmrok’ at 15 DOS, TA reached 0.9% at both 5 and 10°C (Fig. 2A), while the TA at 18°C reached 0.4% at 9 DOS. The TA of ‘Hayward’ kiwifruit stored at 5 and 10°C decreased from 2.0 to 1.4% at 15 DOS, and was significantly low (0.9%, p < 0.05) at 18°C (Fig. 2B). ‘Goldone’ kiwifruit showed decreased TA at 15 DOS as 1.3 and 1.2% at 5 and 10°C, respectively (Fig. 2C). It reached 0.8% at 9 DOS at 18°C. In ‘Jecy Gold’ kiwifruit, TA was 1.4% at both 5 and 10°C after 15 DOS (Fig. 2D), while the TA at 18°C reached 0.8% at 9 DOS. Hence, the reduction of TA was more rapid at high storage temperatures.
During kiwifruit ripening the TA content tended to decline and the rate of this decline varied depending on the cultivar, storage temperature, and storage time. The lowest TA was detected from green-fleshed ‘Garmrok’, followed by yellow-fleshed ‘Goldone’. Green-fleshed ‘Hayward’ had the highest TA, followed by yellow-fleshed ‘Jecy Gold’. TA directly indicates the concentrations of major organic acids, i.e., citric, malic, oxalic, and quinic acids. During fruit ripening, cell respiration is increased and organic acids are used as respiratory substrates, which reduces the organic acids content and therefore, titratable acidity (Barboni et al., 2010; Shahkoomahally and Ramezanian, 2015; Shiri et al., 2016). The high reduction in TA at the high temperature (18°C) might have been due to the increased respiration rate that more quickly degraded the organic acids. In contrast, at the low temperature (5°C) the degradation of organic acids might have been inhibited by a reduced respiration rate, which slowed the reduction in TA. Similar changes in TA were also observed in some other kiwifruit during cold storage (Park et al., 2006; Zolfaghari et al., 2010; Shahkoomahally and Ramezanian, 2015; Shiri et al., 2016).
SSC/TA Ratio
The SSC/TA ratio is used to determine the optimum harvesting time, fruit ripeness, and taste (Zolfaghari et al., 2010). An increasing trend in SSC/TA ratios was observed over the storage period for all kiwifruit cultivars (Fig. 3A-3D). The rate of increase of the SSC/TA ratio was more pronounced with increasing storage temperature. The significantly highest SSC/TA ratios (p < 0.05) were recorded at 18°C for all kiwifruit cultivars along with the storage period, whereas the significantly lowest SSC/TA ratios (p < 0.05) were recorded at 5°C. The significantly highest SSC/TA ratios (p < 0.05) were found in ‘Garmrok’ kiwifruit. Our results indicated that the kiwifruit ripening rate is significantly affected by the storage temperature as ripening is more pronounced at higher storage temperatures. Further, the increase in the SSC/TA ratio during storage was correlated with the increase of SSC followed by the decline of TA. Therefore, the balance between SSC and TA is very important for the overall acceptability of kiwifruit. These observations are in accordance with those of similar studies (Zolfaghari et al., 2010; Shiri et al., 2016; Yang and Lim, 2017a, Yang and Lim, 2017b).
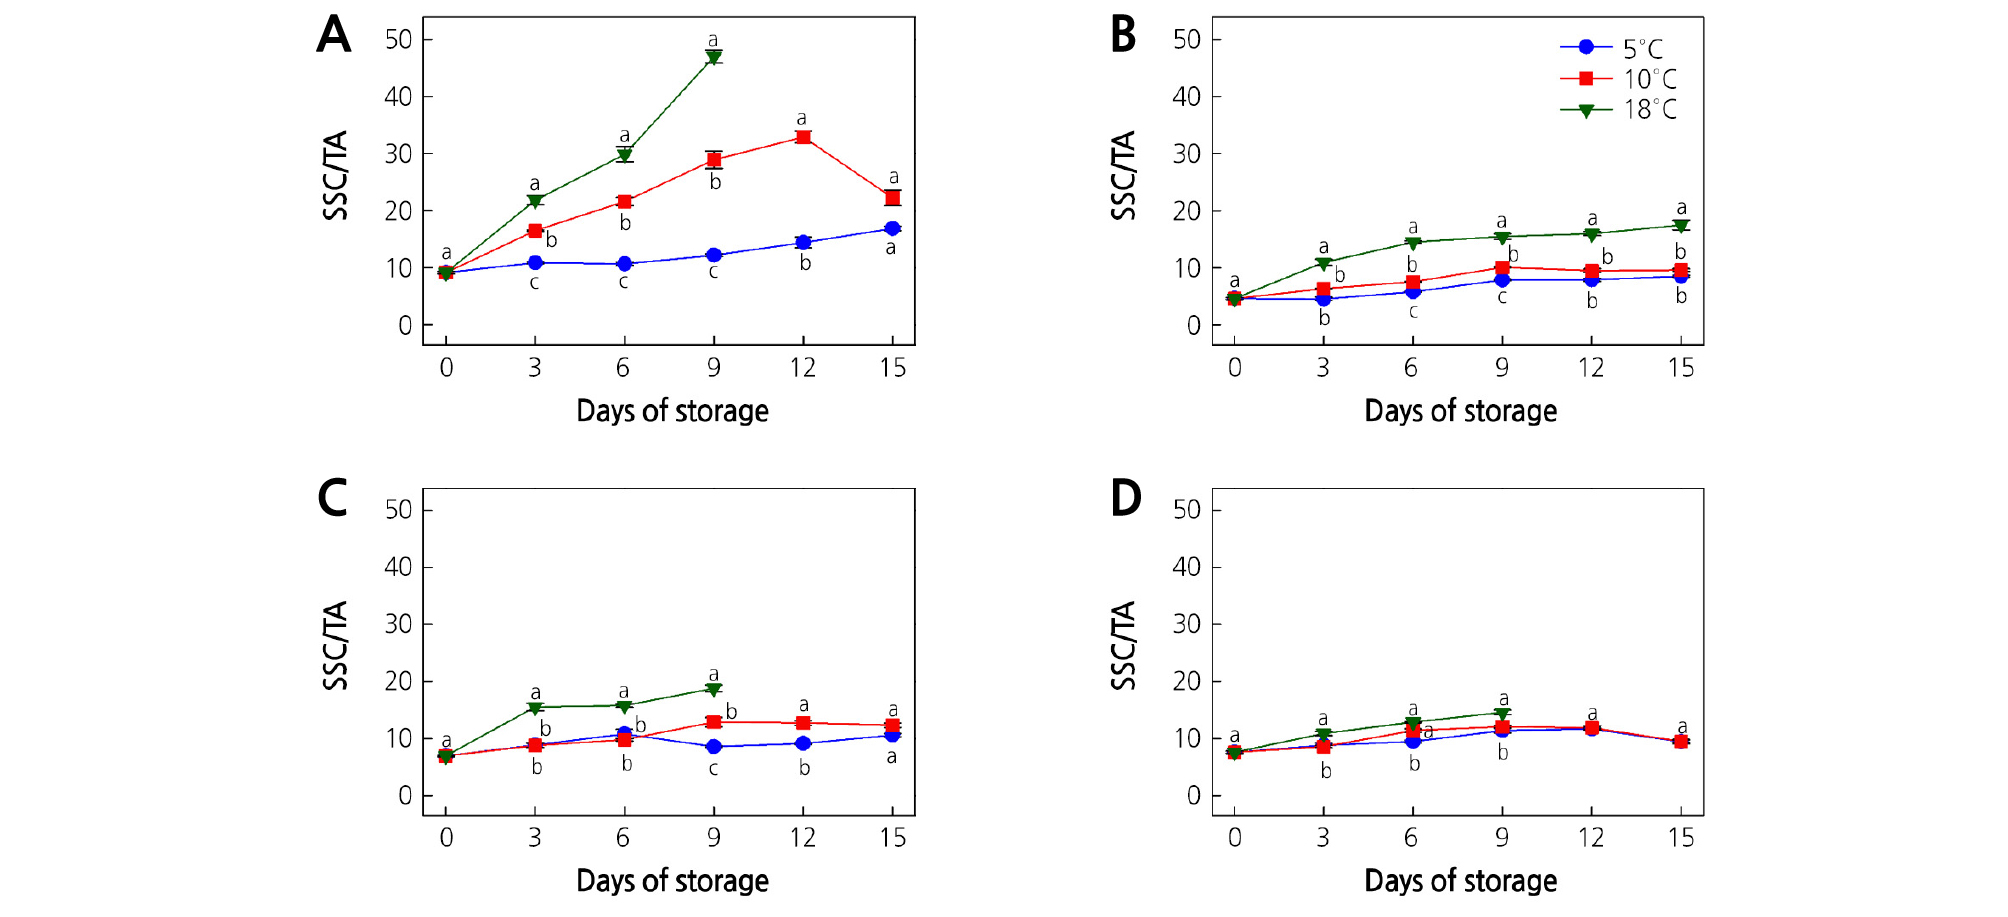
Fig. 3.
Effect of storage temperature on the SSC/TA ratio of (A) ‘Garmrok’, (B) ‘Hayward’, (C) ‘Goldone’, and (D) ‘Jecy Gold’ kiwifruit. Vertical bars indicate SE (n = 10). The same letters for each storage temperature describe means which do not differ significantly at p < 0.05 according to Duncan’s test, as analyzed by statistical analysis software (SAS).
Flesh and Core Firmness
Maintaining kiwifruit firmness after harvest is very important as it greatly determines the kiwifruit storage-life and quality. In this study, the kiwifruit firmness gradually declined during the cold storage period (Figs. 4 and 5). The rate of decrease in firmness was more pronounced with increasing storage temperature. Both flesh firmness (FF) and core firmness (CF) were rapidly decreased at 18°C, while kiwifruit at 5 and 10°C retained significantly (p < 0.05) higher firmness throughout the storage time. The significantly highest FF and CF values (p < 0.05) were recorded at 5°C for all kiwifruit cultivars at all storage times. Significantly low FF and CF values (p < 0.05) were recorded at 18°C. Our results correspond with the findings of Park and Kim (2015) where the firmness of A. arguta was rapidly decreased at 15 and 20°C, but slowly decreased at 5 and 10°C.
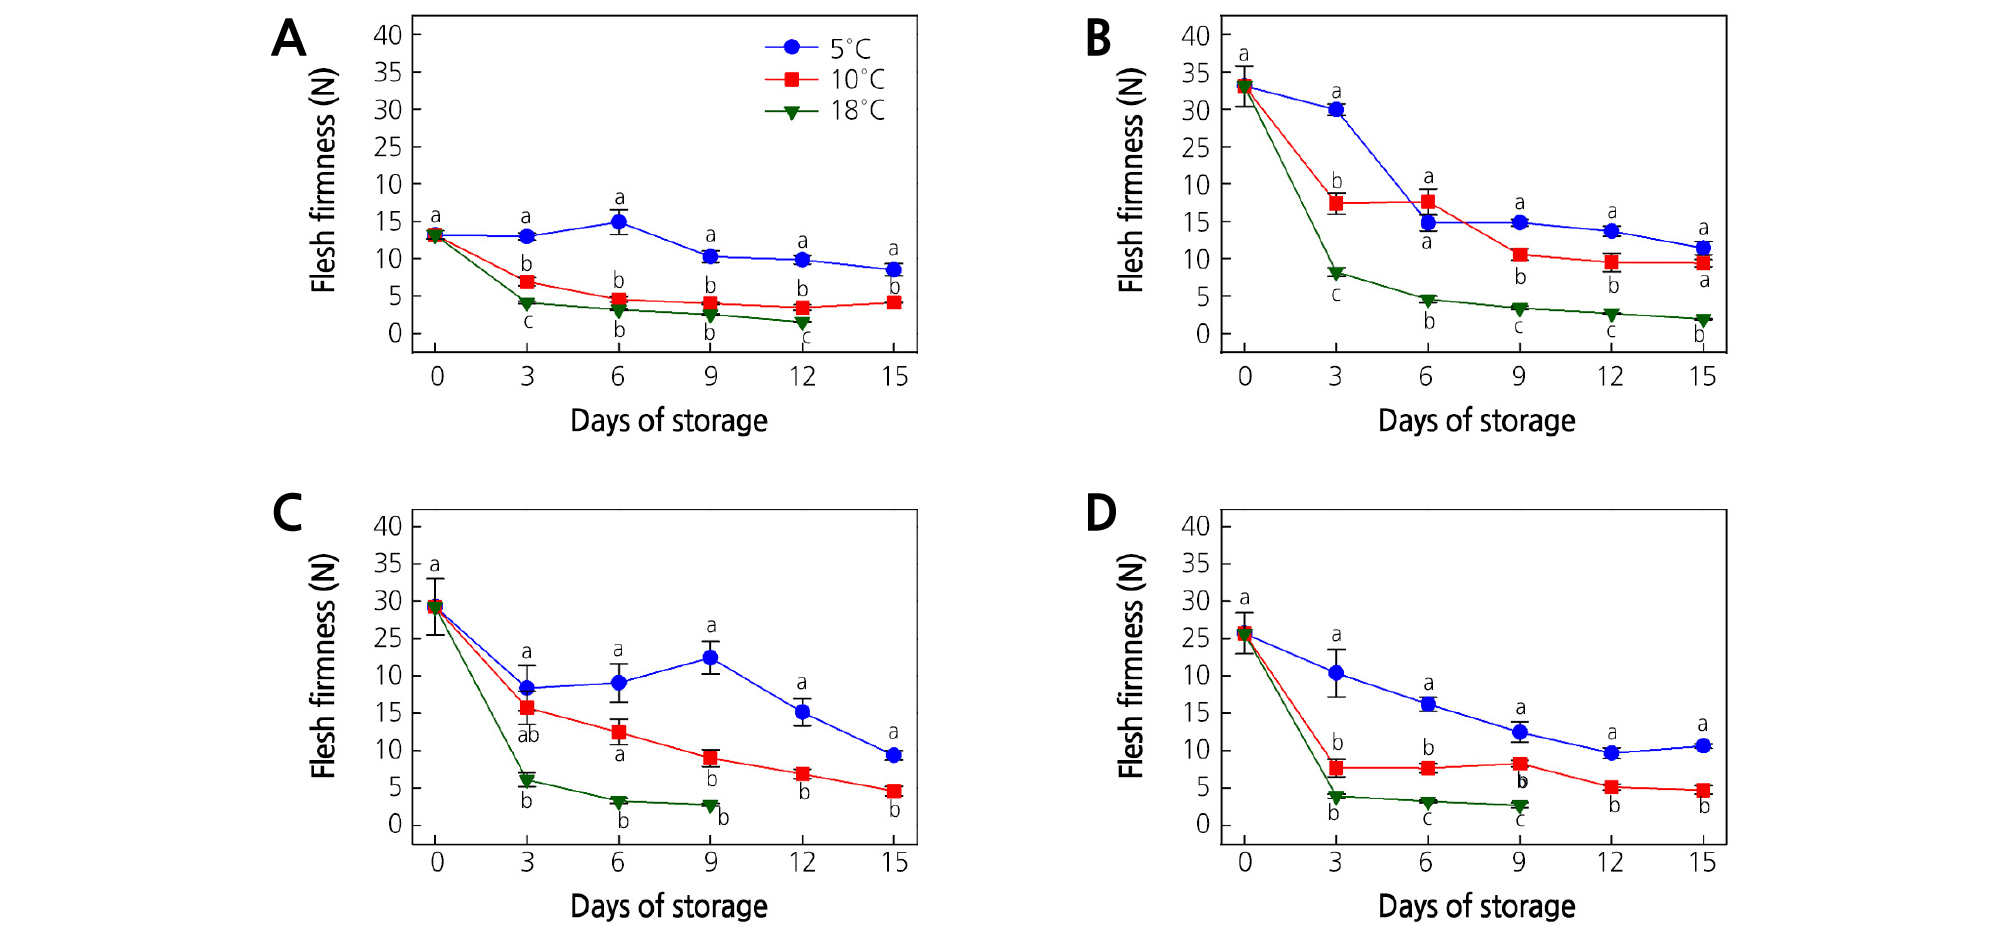
Fig. 4.
Effect of storage temperature on flesh firmness of (A) ‘Garmrok’, (B) ‘Hayward’, (C) ‘Goldone’, and (D) ‘Jecy Gold’ kiwifruit. Vertical bars indicate SE (n = 10). The same letters for each storage temperature describe means which do not differ significantly at p < 0.05 according to Duncan’s test, as analyzed by statistical analysis software (SAS).
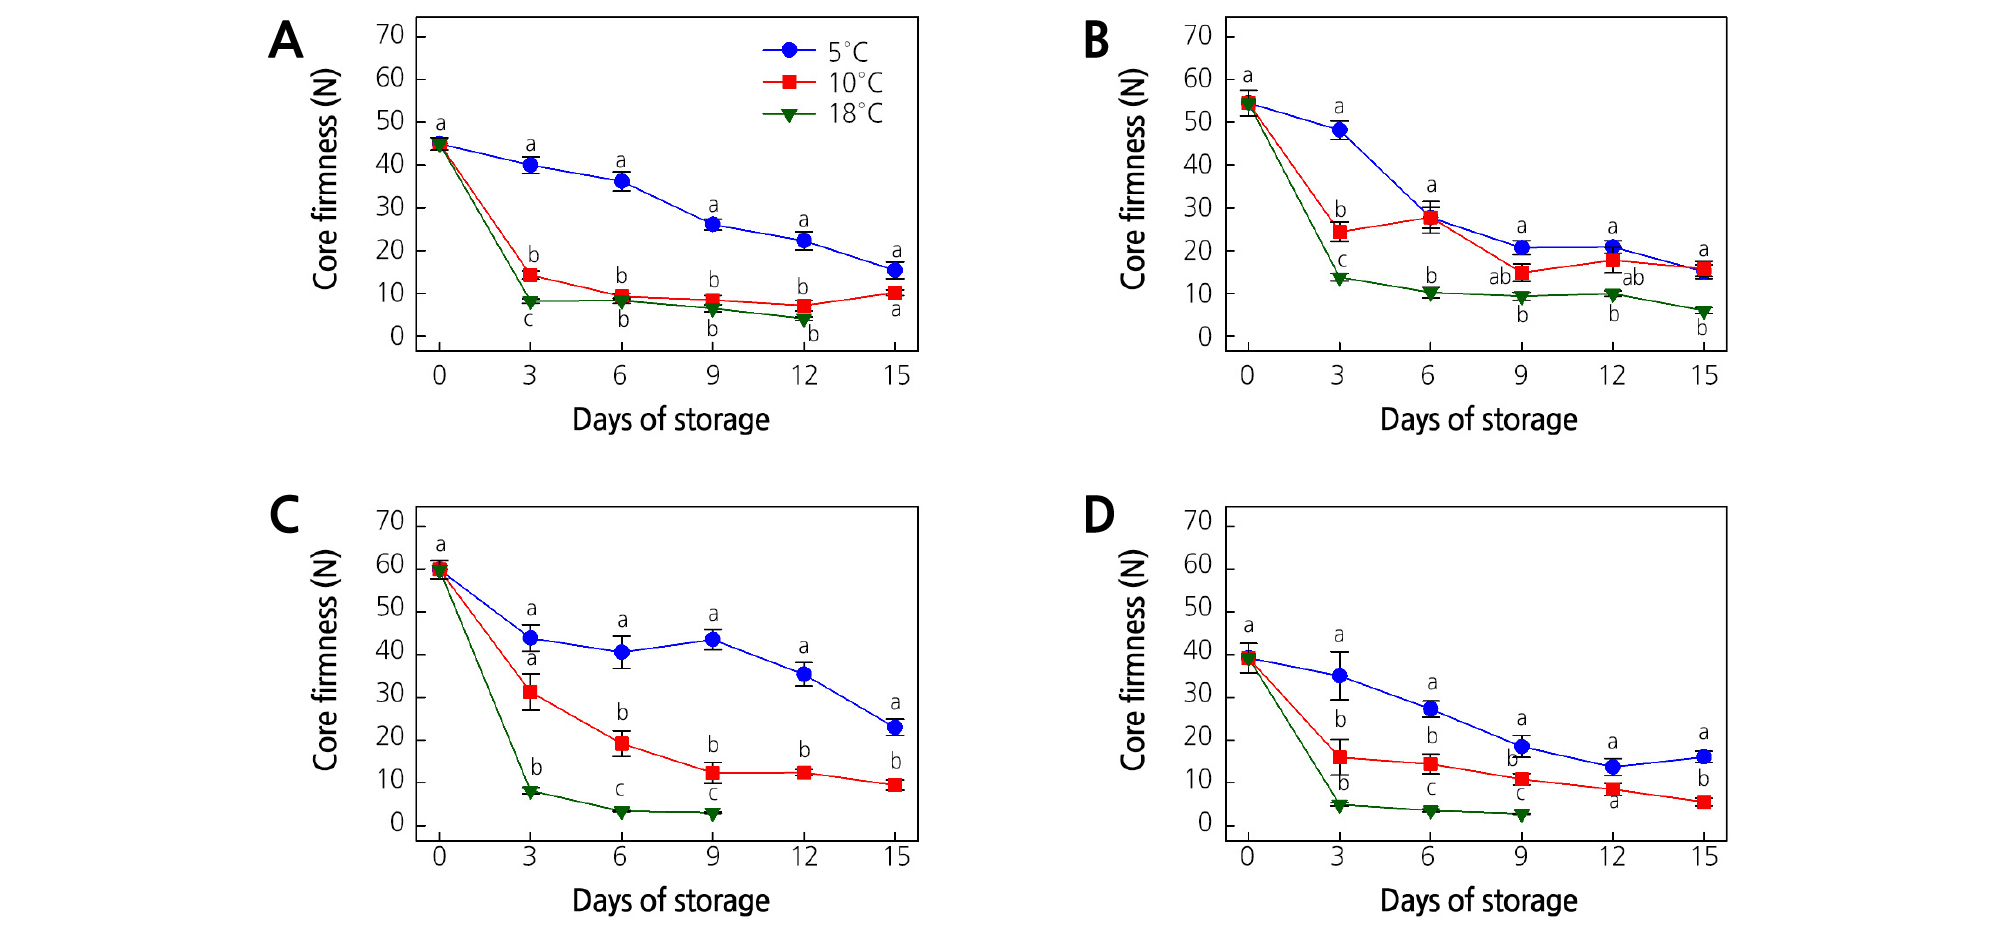
Fig. 5.
Effect of storage temperature on core firmness of (A) ‘Garmrok’, (B) ‘Hayward’, (C) ‘Goldone’, and (D) ‘Jecy Gold’ kiwifruit. Vertical bars indicate SE (n = 10). The same letters for each storage temperature describe means which do not differ significantly at p < 0.05 according to Duncan’s test, as analyzed by statistical analysis software (SAS).
At harvest, ‘Garmrok’, ‘Hayward’, ‘Goldone’, and ‘Jecy Gold’ kiwifruit had an average FF of 13.2, 33.1, 29.3, and 25.7 N, respectively (Fig. 4A-4D). The FF of ‘Garmrok’ kiwifruit stored at 5 and 10°C softened to 8.5 and 4.1 N, respectively, after 15 DOS, and they were significantly different (p < 0.05) (Fig. 4A). The FF of ‘Garmrok’ kiwifruit stored at 18°C softened to 1.5 N at 12 DOS. At 15 DOS, ‘Hayward’ kiwifruit softened to 11.4 and 9.4 N at 5 and 10°C, respectively, and were not significantly different (p > 0.05) (Fig. 4B). However, at 15 DOS, a significantly low (p < 0.05) FF of 1.9 N was recorded from ‘Hayward’ kiwifruit stored at 18°C. Similarly, at 15 DOS, the FF of ‘Goldone’ kiwifruit stored at 5 and 10°C softened to 9.4 and 4.6 N (p < 0.05), respectively (Fig. 4C). The FF of ‘Goldone’ kiwifruit stored at 18°C was significantly low (2.8 N, p < 0.05) at 9 DOS. Similarly, at 15 DOS, the FF was 10.6 and 4.7 N (p < 0.05) for ‘Jecy Gold’ kiwifruit stored at 5 and 10°C, respectively (Fig. 4D), and ‘Jecy Gold’ kiwifruit underwent faster softening at 18°C, reached a FF of 2.7 N (p < 0.05) at 9 DOS.
‘Garmrok’ kiwifruit softened from an average CF of 45.0 N at harvest to 15.4 and 10.2 N (p > 0.05) after 15 DOS at 5 and 10°C, respectively (Fig. 5A). The CF of ‘Garmrok’ kiwifruit stored at 18°C reached 4.1 N (p < 0.05) at 12 DOS. The average CF of ‘Hayward’ kiwifruit at harvest was 54.5 N and softened to 15.1, 15.8 (p > 0.05), and 6.0 N (p < 0.05) at 15 DOS at 5, 10, and 18°C, respectively (Fig. 5B). The CF of ‘Goldone’ and ‘Jecy Gold’ kiwifruit was 59.9 and 39.2 N at harvest, respectively (Fig. 5C and 5D). At 15 DOS the CF of ‘Goldone’ kiwifruit stored at 5 and 10°C reached 23.0 and 9.5 N (p < 0.05), respectively (Fig. 5C). With a rapid decline of CF at 18°C, ‘Goldone’ kiwifruit softened to 3.1 N at 9 DOS. The CF of ‘Jecy Gold’ gradually decreased to 16.1 and 5.6 N (p < 0.05) after 15 DOS at 5 and 10°C, respectively (Fig. 5D). A significantly low (p < 0.05) CF of 2.8 N at 9 DOS was recorded for ‘Jecy Gold’ kiwifruit stored at 18°C. The reduction in kiwifruit firmness generally increased as storage temperature and time increased and our results are in accordance with those of several similar studies (Park et al., 2006; Mworia et al., 2012, Shahkoomahally and Ramezanian, 2015; Shiri et al., 2016; Yang and Lim, 2017a, Yang and Lim, 2017b).
Organic Acids
Kiwifruit taste mainly depends on the balance between soluble sugars and non-volatile organic acids. Organic acids are responsible for the different perception of acidity and slower bacterial spoilage in kiwifruit (Nishiyama et al., 2008). At harvest, the organic acids are composed of about 40 - 60% citric acid, 40 - 60% quinic acid, and 10% malic acid (Marsh et al., 2004; Marsh and Harker, 2016). Among these, citric and malic acids are frequently found in different kinds of commercial fruit (Nishiyama et al., 2008; Marsh and Harker, 2016). The storage temperature plays a prominent role in organic acid metabolism with a large effect on fruit sensory attributes (Marsh et al., 2004). Figs. 6 and 7 depict the changes of citric and malic acids in kiwifruit during cold storage.
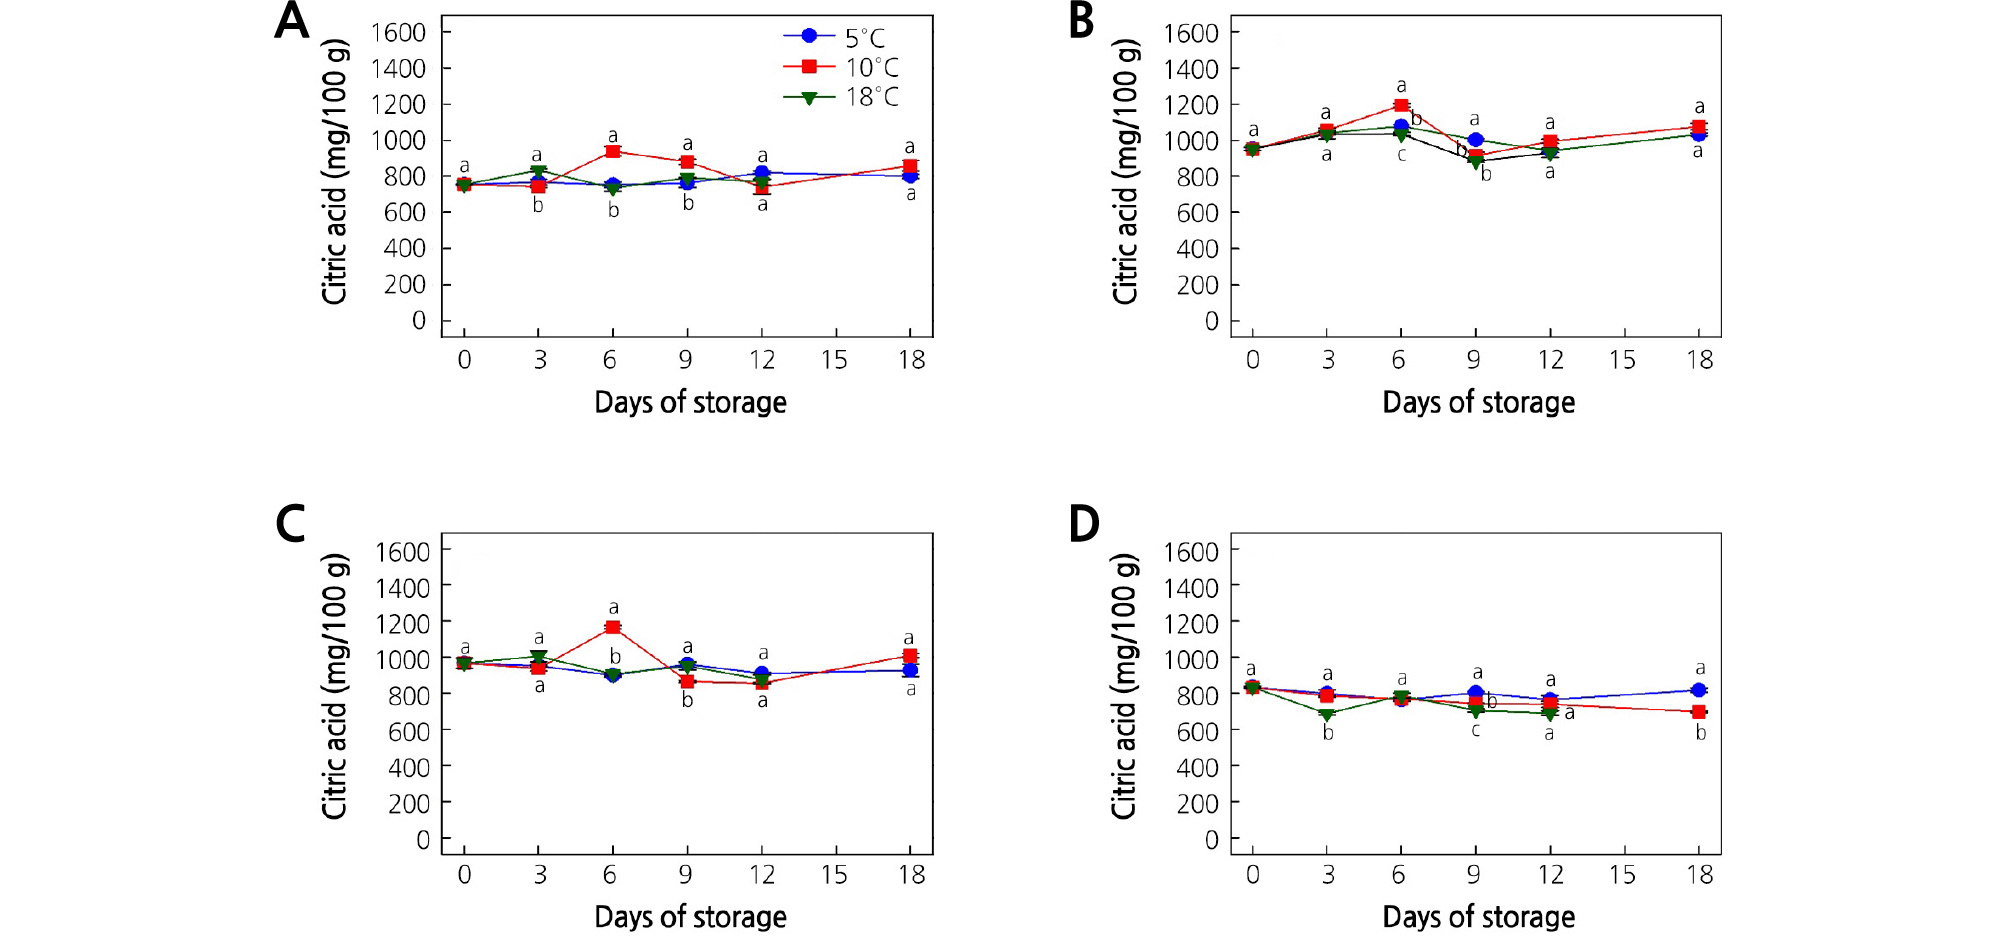
Fig. 6.
Effect of storage temperature on the citric acid content of (A) ‘Garmrok’, (B) ‘Hayward’, (C) ‘Goldone’, and (D) ‘Jecy Gold’ kiwifruit. Vertical bars indicate SE (n = 5). The same letters for each storage temperature describe means which do not differ significantly at p < 0.05 according to Duncan’s test, as analyzed by statistical analysis software (SAS).
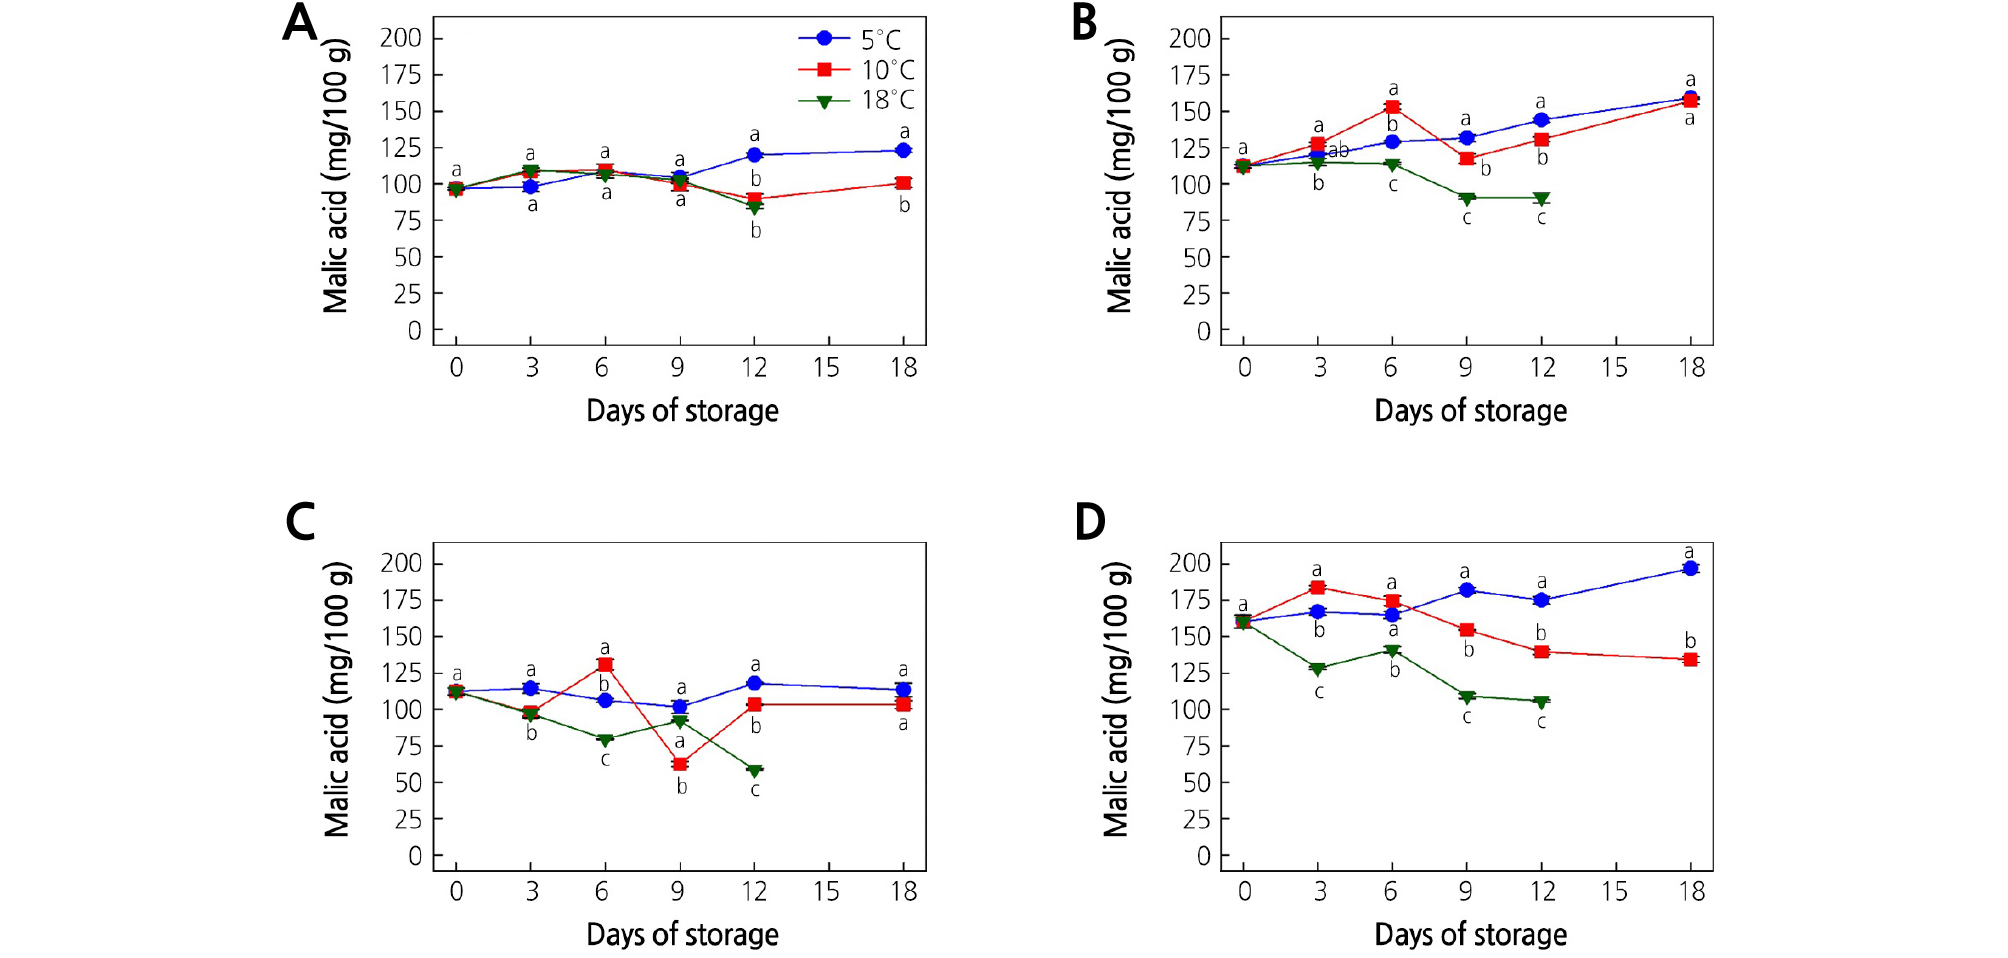
Fig. 7.
Effect of storage temperature on the malic acid content of (A) ‘Garmrok’, (B) ‘Hayward’, (C) ‘Goldone’, and (D) ‘Jecy Gold’ kiwifruit. Vertical bars indicate SE (n = 5). The same letters for each storage temperature describe means which do not differ significantly at p < 0.05 according to Duncan’s test, as analyzed by statistical analysis software (SAS).
Citric Acid (CA)
At harvest, the CA contents were 754.4, 950.9, 966.2, and 833.6 mg/100 g in ‘Garmrok’, ‘Hayward’, ‘Goldone’, and ‘Jecy Gold’, respectively (Fig. 6A-6D). Though significant (p < 0.05) fluctuations of CA at the three different storage temperatures were detected in the early storage period, the CA contents at 18 DOS were not significantly different (p > 0.05) at the three storage temperatures, except in ‘Jecy Gold’ kiwifruit. A significant peak (p < 0.05) of CA content was detected at 6 DOS in ‘Garmrok’ (938.2 mg/100 g), ‘Hayward’ (1,192.4 mg/100 g), and ‘Goldone’ (1,164.2 mg/100 g) kiwifruit stored at 10°C. The changes of CA content in ‘Jecy Gold’ kiwifruit were different from those of the other cultivars (Fig. 6D). At 18 DOS, ‘Garmrok’ kiwifruit stored at 5 and 10°C had a CA content of 800.1 and 858.1 mg/100 g (p > 0.05), respectively. ‘Garmrok’ kiwifruit stored at 18°C reached a CA content of 769.5 mg/100 g (p > 0.05) at 12 DOS (Fig. 6A). In ‘Hayward’ kiwifruit, the CA content at 18 DOS was 1,030.4 and 1,073.9 mg/100 g (p > 0.05) at 5 and 10°C, respectively. At 18°C, it was 929.5 mg/100 g (p > 0.05) in ‘Hayward’ kiwifruit at 12 DOS (Fig. 6B). The CA contents of ‘Goldone’ kiwifruit stored at 5 and 10°C were 926.8 and 1,008.5 mg/100 g (p > 0.05) at 18 DOS. The CA content of ‘Goldone’ kiwifruit stored at 18°C was 876.2 mg/100 g (p > 0.05) at 12 DOS (Fig. 6C). In contrast, ‘Jecy Gold’ kiwifruit at 18 DOS showed CA contents of 817.5 and 698.1 mg/100 g (p < 0.05) at 5 and 10°C, respectively. The CA contents of ‘Jecy Gold’ kiwifruit stored at 18°C reached 690.4 mg/100 g (p > 0.05) at 12 DOS (Fig. 6D).
Malic Acid (MA)
At harvest, the MA contents of ‘Garmrok’, ‘Hayward’, ‘Goldone’, and ‘Jecy Gold’ were 96.7, 112.3, 112.4, and 160.5 mg/100 g, respectively (Fig. 7A-7D). Thereafter, the MA content fluctuated throughout the storage period, and at 18 DOS the ‘Garmrok’ kiwifruit stored at 5 and 10°C reached 123.1 and 100.6 mg/100 g (p < 0.05), respectively. The MA content of ‘Garmrok’ kiwifruit stored at 18°C was 84.5 mg/100 g (p < 0.05) at 12 DOS (Fig. 7A). The MA contents of ‘Hayward’ kiwifruit stored at 5 and 10°C were 159.2 and 157.1 mg/100 g (p > 0.05), respectively, after 18 DOS. The MA content of ‘Hayward’ kiwifruit stored at 18°C reached 90.5 mg/100 g (p < 0.05) at 12 DOS (Fig. 7B). At 18 DOS at 5 and 10°C, the ‘Goldone’ kiwifruit had MA contents of 113.5 and 103.4 mg/100 g (p > 0.05), respectively. The MA content of ‘Goldone’ kiwifruit stored at 18°C was 58.7 mg/100 g (p < 0.05) at 12 DOS (Fig. 7C). From harvest to 18 DOS, relatively high MA contents were detected in ‘Jecy Gold’ kiwifruit compared to the other three cultivars (Fig. 7D). The MA content of ‘Jecy Gold’ kiwifruit at harvest (160.5 mg/100 g) declined to 197.0 and 134.4 mg/100 g (p < 0.05) after 18 DOS at 5 and 10°C, respectively. The MA content of ‘Jecy Gold’ kiwifruit stored at 18°C reached 105.9 mg/100 g (p < 0.05) at 12 DOS.
According to our findings, CA was more predominant than MA in all kiwifruit cultivars throughout the storage time. A higher CA content during cold storage was detected in ‘Hayward’ kiwifruit, followed by ‘Goldone’, ‘Garmrok’, and ‘Jecy Gold’. A higher MA content during cold storage was detected in ‘Jecy Gold’ kiwifruit, followed by ‘Hayward’, ‘Goldone’, and ‘Garmrok’. Moreover, in agreement with Nishiyama et al. (2008), CA and MA contents did not vary greatly during cold storage among A. deliciosa and A. chinensis. Nishiyama et al. (2008) determined the organic acid contents at the eating-ripe stage in various Actinidia genotypes and revealed that CA and quinic acid were the predominant organic acids in A. deliciosa and A. chinensis, although MA was present in much smaller amounts. Our results are also consistent with the results of Nishiyama et al. (2008) in that 1.10 g/100 gCA and 0.22 g/100 g MA were quantified in eating-ripe ‘Hayward’ kiwifruit.
These differences in organic acid fractions in different cultivars may affect the kiwifruit flavor. Significantly low proportions of both organic acids were detected at 18°C compared to those at 5 and 10°C. Moreover, the CA content showed a declining tendency in all tested kiwifruit cultivars regardless of the storage temperature, but the rate of decline was relatively low in kiwifruit stored at 10°C. In contrast, the MA content showed an increasing tendency in all tested kiwifruit cultivars stored at 5 and 10°C, but not at 18°C, where a steady decline was observed. Our observations are in accordance with the findings of Marsh et al. (2004) who reported an increase of MA in ‘Hayward’ kiwifruit stored at 4°C compared to 0°C, and fruit stored at 10°C having somewhat intermediate MA levels. Further, Marsh et al. (2004) detected higher levels of CA in kiwifruit stored at 10°C compared to 0 or 4°C, and a steady decline in CA was found in kiwifruit stored at 0°C but a lower rate of decline of CA was found in kiwifruit stored at 10°C. The acid:sugar balance affects the acceptance of kiwifruit by consumers. The sugar balance within kiwifruit is primarily dependent on the CA content of the fruit (Marsh and Harker, 2016). CA has a greater effect on consumer perception of fruit acidity compared with MA (Marsh and Harker, 2016). Consequently, the temperature management during kiwifruit storage and ripening is a critical factor that may directly influence the acid accumulation within kiwifruit, and hence, the consumers’ acceptability of “ready to eat” kiwifruit. Although the enzymes associated with acid accumulation are well known, the mechanism behind acid accumulation is not well understood (Marsh and Harker, 2016).
Conclusions
The amount of SSC and MA and the SSC/TA ratio tended to increase, while TA, firmness, and CA content tended to decline during kiwifruit ripening. The rates of increase and decrease varied depending on the cultivar, storage temperature, and storage time. Further, kiwifruit ripening is accelerated by the exogenous ethylene treatment, but the lower temperature delayed the climacteric peak, and subsequently ripening (Park et al., 2006; Yang and Lim, 2017a, Yang and Lim, 2017b). A better understanding of the influences of storage temperature on kiwifruit shelf-life and quality during ripening will better ensure the supply of a consistently high quality product to the fresh market. The ripening and quality of kiwifruit cultivars ‘Garmrok’, ‘Hayward’, ‘Goldone’, and ‘Jecy Gold’ treated with exogenous ethylene were least affected when stored at 5°C, but suffered rapid degradation at 18°C. Thus, temperature management during kiwifruit storage and ripening directly correlates with the qualitative attributes and influences consumers’ acceptability of “ready to eat” kiwifruit.
