

Introduction
Materials and Methods
Plant Materials and Growing Conditions
Light Environment and Spectrum
Growth Assessment
Analysis of Total Phenolic Content
Measurement of Antioxidant Levels
Statistical Analysis
Results and Discussion
Plant Growth
Total Phenolic Content and Antioxidant Level
Light Use Efficiency
Introduction
Environmental factors such as light, temperature, humidity, CO2 concentration, and nutrient supply have significant impacts on the growth and development of plants. Among these, light is considered the major factor controlling plant growth and development (Inada and Yabumoto, 1989; Gaudreau et al., 1994) because it is the main source of energy for photosynthesis and plays an important role in plant development as a stimulus signal (Wang et al., 2009). Therefore, many studies have investigated the effects of light conditions on the nutritional quality, growth and development, and phytochemical biosynthesis of plants.
Light intensity, light quality, and photoperiod can influence plants. Among these, high light intensity (HL) has increased the fresh weight of various kinds of lettuce (Lactuca sativa) (Knight and Mitchell, 1983a, 1983b; Gaudreau et al., 1994; Pavlou et al., 2007; Fu et al., 2012) and decreased nitrate concentrations in plants by increasing nitrate reductase activity (Blom-Zandstra et al., 1988; Gaudreau et al., 1995). Light quality, which is determined by the ratio of different wavelengths of light ranging from UV, visible light, to far-red light, has many sensitive effects on plants (Son et al., 2012; Samuolienė et al., 2013; Lee et al., 2014, 2015, 2016; Park et al., 2016; Jeon et al., 2017, 2018). Therefore, light quality has various effects on the development and morphogenesis of plants (McNellis and Deng, 1995). Photoperiod not only affects the flowering of plants, but also the growth of leafy vegetables such as spinach (Spinacia oleracea) and lettuce (Inada and Yabumoto, 1989; Ali et al., 2009). In addition, extending the photoperiod increased the fresh and dry weights of lettuce (Ikeda et al., 1988; Koontz and Prince, 1986).
Recently, plant factories that use artificial lights and nutrients for plant production have become popular and important owing to the increasing prices of crops and potential for a more stable food production system (Um et al., 2010). Plant factories generally use two types of light (sunlight and artificial light) in various combinations (Hashimoto et al., 1987). Sunlight is free, but it is difficult to control the quality and photoperiod. On the other hand, light conditions such as photoperiod can be easily controlled in plant factories that use artificial light (Kitaya et al., 1998). In addition, temperature, humidity, CO2 concentration, air flux, nutrients, and moisture can be controlled, regardless of outside environments (TIIC, 2009). Therefore, by using appropriate conditions of light and other factors, the effective production of crops with standardized quality could be possible. Among these factors, use of artificial light is an expensive, complex, and labor-intensive part of plant factories. Using continuous light without a dark period in order to increase the lifespan of the lamps and reduce the number of lamps required reduces the cost of factory operation (Koontz and Prince, 1986). Therefore, improving the turnover rate and profits through enhanced light source efficiency and shortened cropping seasons are crucial to maintaining the sustainability and profitability of the plant factory industry.
Artificial light sources for plant production systems include high-pressure sodium lamps, metal haloid lamps, fluorescent lamps (FLs), and light-emitting diodes (LEDs) (Tibbitts et al., 1983; Kim et al., 2008; Um et al., 2009; Lee et al., 2014, 2015, 2016). These sources have been widely used in greenhouses, plant factories, and plant growth chambers (Sase and Ling, 1996). High-pressure sodium lamps and metal haloid lamps have high light efficiency, but lack blue and red light, respectively, and must therefore be used in conjunction with other light sources. A lot of research on light sources in closed plant factory systems have shown the good performance of LEDs. Whereas, some reports showed that FLs increased plant biomass similar to LEDs (Lee et al., 2012).
FLs have a spectrum appropriate for proximity lighting and are therefore widely used in plant production facilities (Kim and Lee, 1998). External electrode fluorescent lamps (EEFLs) are a new type of FL with electrodes attached outside of the tube, unlike the traditional fluorescent lamp in which the electrodes are inside. These lamps have commonly been used as the source for the back light unit (BLU) of LCD TVs and the light source of outdoor or indoor billboards (Lee et al., 2005). Light is generated when the gas is discharged by induced plasma without exposure to electrodes in the tube, resulting in EEFLs having a longer life. Furthermore, multiple EEFL tubes can be connected to a single power supplier, enabling low initial installation costs. Therefore, EEFLs have the potential for use as a new alternative artificial light source combining the high light quality of FLs with the low cost of operation of LEDs.
Lettuce has frequently been used as a model plant to study responses to light in plant factories (Dougher and Bugbee, 2001; Park et al., 2013; Son and Oh, 2013). Although many experiments have studied the growth response caused by variations in light intensity or photoperiod separately, there is little information available regarding the combination of these two conditions and the daily light integral [DLI, photosynthetic photon flux density (PPFD) × photoperiod], except for the studies by Park et al. (2012), Zhang et al. (2018), and Yan et al. (2019a, 2019b). Under the same DLI, plant length, leaf dry weight, leaf area, and leaf number of Achimenes were greater under low light intensity (LL) than HL; therefore, the light use efficiency (LUE) was higher in the combination of LL and long photoperiod (Vlahos et al., 1991). Lettuce grown under continuous incandescent light showed increased fresh weight, dry weight, and leaf area relative to those grown under a 16 h photoperiod, resulting in a 10% reduction in electricity cost per unit weight (Ohyama et al., 2005).
Light quantity, determined by the light intensity and duration, also influenced the concentration of phytochemicals and antioxidant activity in lettuce (Park et al., 2012; Kang et al., 2013; Colonna et al., 2016; Craver et al., 2017; Yan et al., 2019a) generating significant interest among consumers due to their health-promoting effects. The correlation between the biosynthesis and accumulation of phytochemicals with the amount of photosynthates produced in plants is well known (Wu et al., 2007). Most of these studies have been conducted using LEDs or conventional FLs in plant factories. Thus, this study was conducted to examine the plant growth and accumulation of phytochemicals of lettuce grown under various combinations of light intensity and photoperiod using EEFLs, and to determine the optimum light conditions in a plant factory.
Materials and Methods
Plant Materials and Growing Conditions
Seeds of ‘Cheongchima’ lettuce (Lactuca sativa) (Nongwoo Bio, Suwon, Korea) were sown on 210-hole sponges and seedlings were grown at 20 ± 3°C; a photosynthetic photon flux density (PPFD) of 170 ± 5 µmol·m-2·s-1; and a 16 h photoperiod with EEFLs (described below) for 14 days. Lettuce seedlings (leaf number: 3, fresh weight: 1 g, dry weight: 0.05 g) were transferred and placed on the culture spaces with three vertical layers at a density of 12 plants per treatment (45 × 75 cm plots). The seedlings were grown for an additional 21 days, harvested, and analyzed. Plant-to-plant distance was 12.5 × 12.5 cm and the location of plants was changed every two days to provide uniform light distribution by plant location. Air temperature, relative humidity, and CO2 concentration were maintained at 20 ± 2°C, 70 ± 10%, and 500 ± 50 µmol·mol-1, respectively.
Yamazaki nutrient solution (Yamazaki, 1982) adjusted to pH 5.8 and electrical conductivity (EC) 1.2 mS·cm-1 was used. The solution was composed of 404 mg·L-1 KNO3, 236 mg·L-1 Ca(NO3)2·4H2O, 57.5 mg·L-1 NH4H2PO4, and 123 mg·L-1 MgSO4·7H2O as the macroelements. The microelement composition was 3 mg·L-1 Fe as Fe-EDTA, 0.5 mg·L-1 H3BO3, 0.5 mg·L-1 MnSO4·4H2O, 0.05 mg·L-1 ZnSO4·7H2O, 0.02 mg·L-1 CuSO4·5H2O, and 0.01 mg·L-1 Na2MoO4·2H2O (Lee et al., 2006). The nutrient solution was supplied by the deep flow technique (DFT) and recirculated from a 50 L nutrient solution container. EC, pH, supply frequency, supply time, and supply amount were controlled using an automatic water supply system (Gafatec, Hwaseong, Korea).
Light Environment and Spectrum
An EEFL kit (EB-7420, 86 watt, Para-ENT, Gyeongsan, Korea) including 20 EEFL tubes (daylight-colored, 3.4 mm dia., 743 mm long, 2 cm gap between tubes) was used and each kit had a size of 75.5 × 42.0 cm. An aluminum reflector board was placed behind the light tubes to increase the lighting efficiency. Two EEFL kits were installed in each photoperiod treatment plot and assigned to a relatively LL or HL intensity treatment. The distance between the light source and plants was adjusted to 14 and 18 cm for the two treatments, respectively, according to plant growth.
The experiment was conducted using 2 levels of light intensities: 150 ± 7.5 (150P) or 200 ± 10 (200P) µmol·m-2·s-1 PPFD at the plant canopy level. Within each light intensity level, the photoperiod (light period in a 24-h cycle) was set to 12, 16, 20, or 24 h (continuous lighting). The light intensity was measured at 14 cm below the light tube using a photometer (LI-250A, Li-Cor, Lincoln, NE, USA) and the spectra of the source light was measured with a spectrometer (PAR-200, J&C Technology, Gimcheon, Korea) (Fig. 1). Light parameters of EEFLs used in this study and FLs (YZ18RR26, 18 W each, electrical ballast NEB118/T8-EM, power factor = 0.98; NVC Co., Huizhou, China) used by Li et al. (2014) were provided for comparison of light sources when PPFDs were 150 µmol·m-2·s-1 (Table 1). The DLI of each light treatment is shown in Table 2.
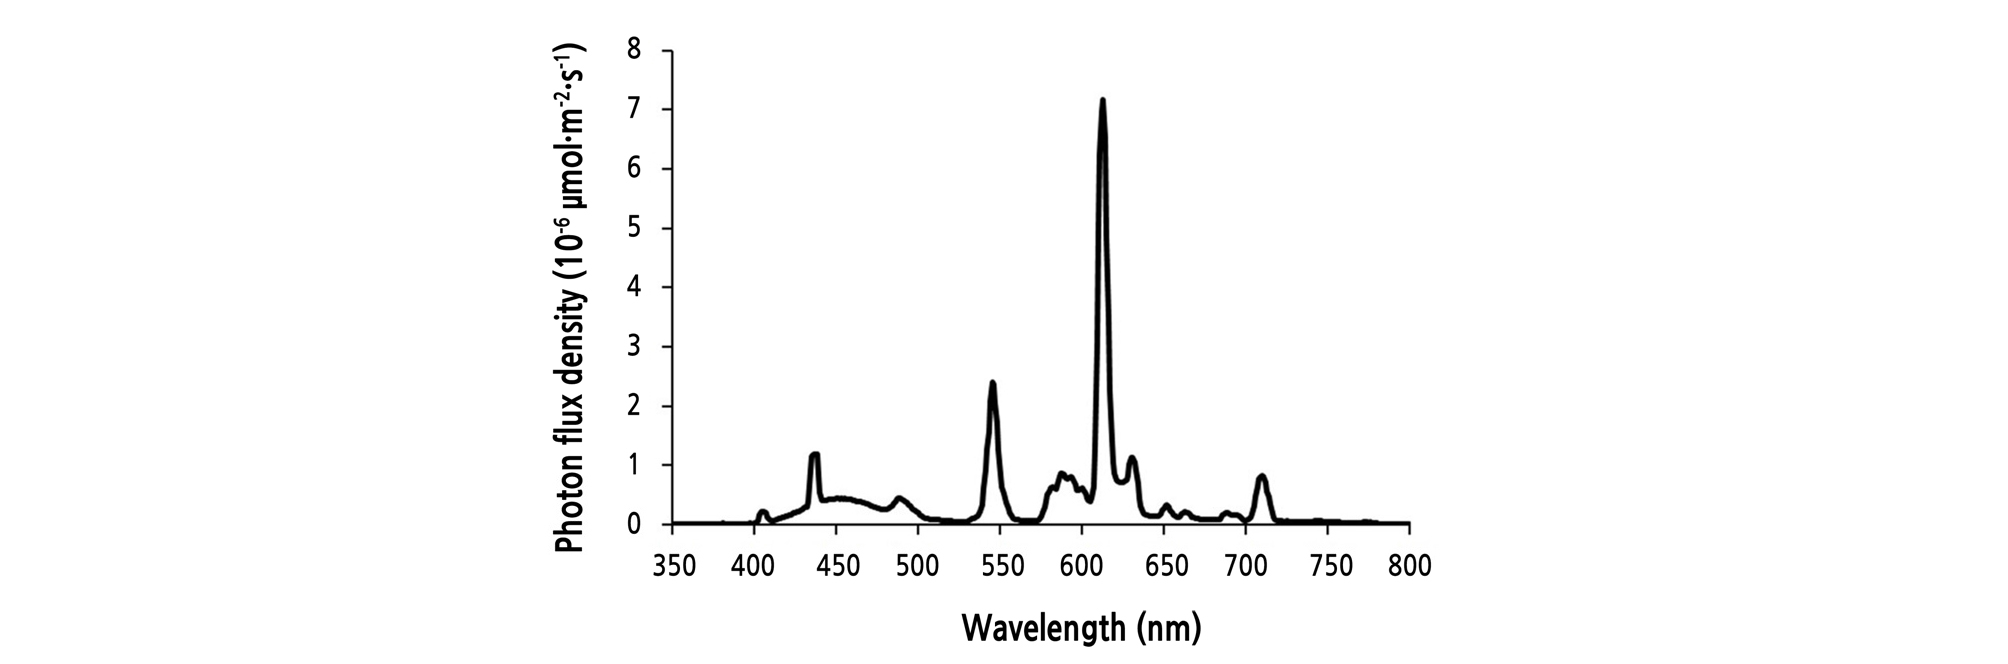
Table 1.
Light parameters of external electrode fluorescent lamps (EEFLs) and 8T fluorescent lamps (FLs) when PPFDs were 150 𝜇mol·m-2·s-1
zFL: 8T fluorescent lamp used in the study of Li et al. (2014).
Table 2.
Daily light integral (DLI) under 150 or 200 𝜇mol·m-2·s-1 PPFD and four photoperiods provided by external electrode fluorescent lamps (EEFLs) in a plant factory during the experiment for 3 weeks
| Photoperiod (h) | DLI (mol·m-2·d-1) | |
| 150 𝜇mol·m-2·s-1 | 200 𝜇mol·m-2·s-1 | |
| 12 | 6.48 | 8.64 |
| 16 | 8.64 | 11.52 |
| 20 | 10.80 | 14.40 |
| 24 | 12.96 | 17.28 |
Growth Assessment
After 3 weeks of treatment, fresh weights of the shoots and roots of lettuce were measured and dry weights were measured after the fresh samples had been dried at 70°C for 48 h in a drying oven (DLI-107A, Daelim Instruments, Korea). Leaf area was measured from the largest leaf of each plant from three plants using a leaf area meter (WinDIAS 3 Image Analysis System, Delta-T Device, Cambridge, UK), and specific leaf weight (SLW) was calculated as mg dry weight per leaf area. The ratio of leaf length/width was calculated as a leaf shape index after measuring the length and width of leaves used in the leaf area measurement. The shoot/root ratio (S/R ratio) was calculated by dividing the fresh weight of shoots by that of the roots. The chlorophyll content was estimated using a portable chlorophyll meter (SPAD-502Plus, Minolta, Osaka, Japan) and expressed as SPAD values. Light use efficiency [LUE, mg dry weight (DW) per mol] was calculated by dividing the dry weight (mg) by the total integral light amount (mol) that the plant received for 21 days. Daily biomass accumulation rate (mg DW/day) was calculated to compare the daily increase (mg) in dry weight of ‘Cheongchima’ lettuce shoots among light treatments in the plant factory.
Analysis of Total Phenolic Content
The total phenolic content was measured after 21 days of treatment using the Folin ‑ Ciocalteu method (Ainsworth and Gillespie, 2007). Fresh leaf tissues (~ 5.0 g) were homogenized with 40 mL 80% methanol and passed through a filter paper. Next, 100 µL of extract was mixed with 9 mL water and 0.5 mL Folin-Ciocalteu solution (Sigma-Aldrich, St. Louis, MO, USA) in a 15 mL tube. After 30 min, 1.5 mL 20% sodium carbonate solution was added. Methanol (80%) was used instead of the extract in the blank. The absorbance at 760 nm was measured after 2 h using a spectrophotometer. A standard curve was generated between 0 and 100 mg·mL-1 gallic acid (Sigma-Aldrich) and the results were expressed as g gallic acid equivalent (GAE) per g fresh weight.
Measurement of Antioxidant Levels
The antioxidant level was measured by the 2,2-diphenyl-1-picrylhydrazyl (DPPH) method (Brand-Williams et al., 1995). The same extract used in the total phenolic content measurement was used in this test. A total of 40 µL of extract was added to 4 mL DPPH solution (2 mg·mL-1 in methanol, Sigma-Aldrich) in a 15 mL tube. For the blank, 40 µL 80% methanol was added instead of the extract. The absorbance at 517 nm was measured after 1 h at 24°C. A standard curve was generated using 0 to 31.25 mg·mL-1 vitamin C and the results were expressed as µg vitamin C equivalent (VCE) per gram fresh weight.
Statistical Analysis
The eight experimental plots with 12 plants each was randomly positioned, and each measurement had nine replications per treatment. Plant data were analyzed using the SAS program (SAS 9.2, SAS Institute, Cary, NC, USA) mixed model procedure (PROC MIXED) and analysis of variance (ANOVA) was performed in SigmaPlot 10.0 (SPSS, Chicago, IL, USA).
Results and Discussion
Plant Growth
Shoot and Root Growth
There were significant differences among the light intensity and photoperiod treatments in the shoot and root fresh weights, shoot dry weight, and the S/R ratio (Table 3 and Fig. 2). Within the 200P treatment, the fresh shoot and root weights increased as the photoperiod was extended from 16 h to 24 h, with the greatest fresh shoot and root weight and dry shoot weight being observed at the 24 h period. The 24 h period resulted in 1.7- and 2.0-fold increases in fresh and dry weight, respectively, relative to the 12 h period. This result was very similar to that of Boston-type lettuce grown under a 24 h photoperiod created by supplemental lighting from high pressure sodium lamps of 100 µmol·m-2·s-1 PPFD (Gaudreau et al., 1994) and kale (Brassica oleracea var. sabellica) in which fresh and dry weight increased as photoperiod increased from 6 h to 24 h under 500 µmol·m-2·s-1 PPFD from cool-white fluorescent and incandescent lamps (Lefsrud et al., 2006). Within the 150P treatments, the shoot fresh weight increased up to the 20 h period, then began to decrease thereafter.
Table 3.
Significance of light intensity (LI), photoperiod (PP), and their interaction (LI × PP) on the characteristics of plant growth, morphology, antioxidant capacity, and light use efficiency in 'Cheongchima' lettuce grown hydroponically for 3 weeks in a plant factory system
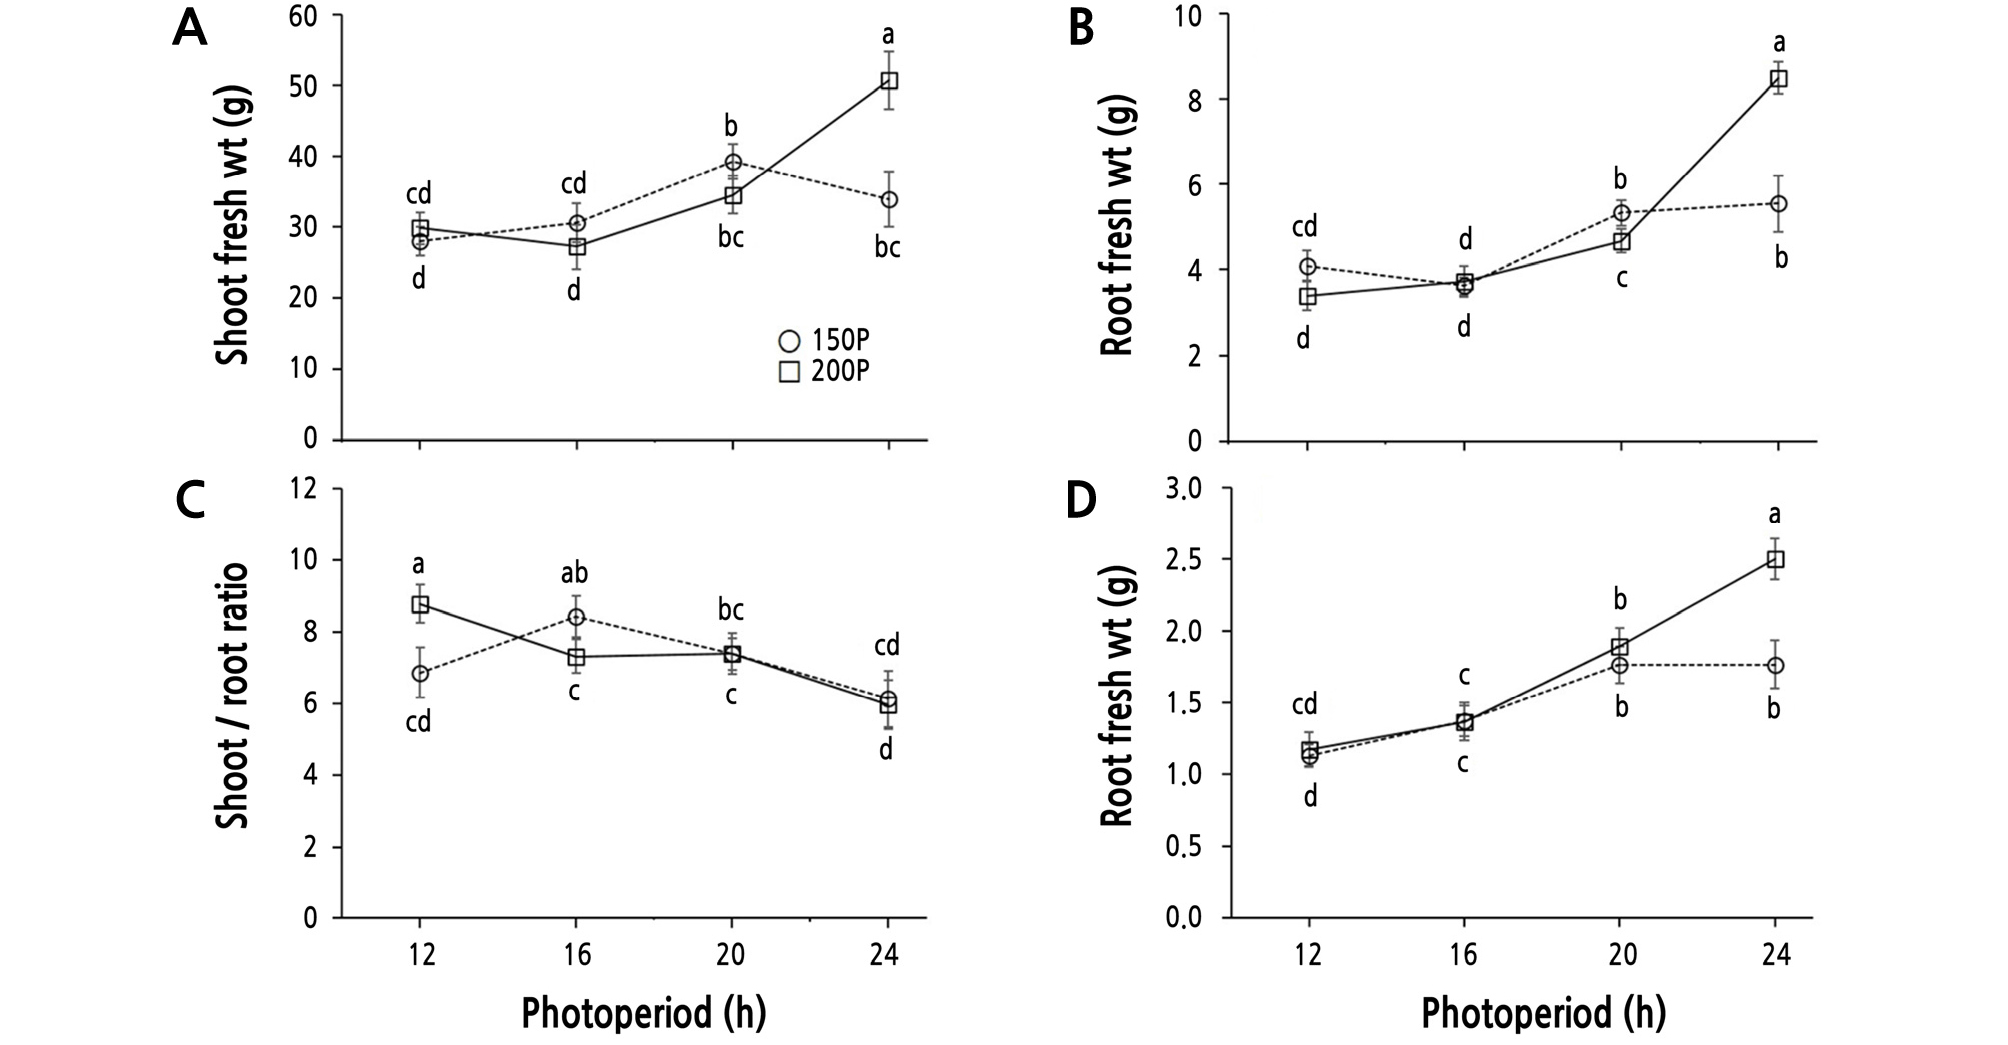
Fig. 2.
Shoot fresh weight (A), root fresh weight (B), shoot/root ratio (C), and shoot dry weight (D) of ‘Cheongchima’ lettuce grown hydroponically under 150 (150P) or 200 (200P) µmol·m-2·s-1 PPFD and four photoperiods provided by external electrode fluorescent lamps (EEFLs) in a plant factory for 3 weeks. Vertical bars indicate the standard error (n = 9). Within-graph means followed by the same letter are not significantly different by Tukey’s honestly significant difference test at p ≤ 0.05.
Inada and Yabumoto (1989) reported better growth of ‘Okayama Saradana’ lettuce under a 20 h photoperiod than under 24 h continuous lighting. In addition, many studies have reported no further increase of biomass by continuous lighting in several crop plants (Sysoeva et al., 2010). Whereas, fresh and dry weight of ‘Seonhong Jeokchukmyeon’ lettuce grown at 100 µmol·m-2·s-1 PPFD provided by white LEDs and FLs increased with increasing photoperiod from 12 to 24 h irrespective of the light source (Park et al., 2012). This discrepancy among crops might be species-specific or result from differences of experimental light conditions including light quality, intensity, and duration.
An increase in biomass is due to an increase in photosynthesis with increasing DLI. Dry weight of ‘Cheongchima’ lettuce in this study increased with an increasing DLI from 6.48 to 17.28 mol·m-2·d-1 (Table 2), which was similar to the reports of various lettuces grown under DLIs from 5.8 to 25.9 mol·m-2·d-1 (Kitaya et al., 1998), 4.32 to 8.64 mol·m-2·d-1 (Park et al., 2012), 10.08 to 14.40 mol·m-2·d-1 (Yan et al., 2019a), 5.04 to 15.12 mol·m-2·d-1 (Yan et al., 2019b), and 6.48 to 17.28 mol·m-2·d-1 (Zhang et al., 2018).
The S/R ratio showed a decreasing trend in response to extended photoperiod except for the 150P/12 h condition, and was highest in lettuce grown under the 200P/12 h condition. There was no significant difference between the 150P/16 h and 200P/12 h conditions, which had the same DLI. Furthermore, the lowest S/R ratio was observed in the 24 h photoperiod at both the 150P and 200P light intensities. The shoot dry weight showed an increasing trend to extended photoperiod, and was highest at the 200P/24 h condition.
The growth rate of shoots and roots in lettuce grown at the 200P light intensity differed from that at 150P, and the S/R ratio at 200P was decreased (Kitaya et al., 1998). The S/R ratio in lettuce increased as photoperiod was extended, but decreased under continuous light (Inada and Yabumoto, 1989). Furthermore, the root weight of spinach increased as light intensity and photoperiod increased (Craker et al., 1983). Based on the fact that the S/R ratio of plants varies depending on the light intensity and photoperiod, an efficient and selective production of plant leaves or roots in a plant factory would be possible. Interestingly, the fresh weight and dry weight showed no significant differences between the 150P/16 h and 200P/12 h conditions, which had identical DLI values (i.e., 150 µmol·m-2·s-1 × 16 h = 200 µmol·m-2·s-1 × 12 h). Conversely, a study by Kitaya et al. (1998) showed that, when the DLI value was the same, longer day length increased plant growth at a low CO2 concentration (400 µmol·mol-1), but not at a high concentration. Based on these findings, the CO2 concentration in our plant factory was assumed to be relatively high at about 500 µmol·mol-1.
Leaf Size and Number
The leaf length showed a decreasing trend with extended photoperiod, especially at 150P (Fig. 3A). Whereas, leaf width showed an increasing trend with extended photoperiod at both 150P and 200P (Fig. 3B). The leaf number and leaf shape also showed clear differences depending on light intensity and photoperiod. Leaf number increased with increasing photoperiod, which was more evident at 200P (Fig. 3C). Leaf number was significantly lower under the 12 h and 16 h periods at both light intensities, but was greatest under the 200P/24 h condition. There was no difference at 150P between 20 h and 24 h, but there was a significant difference at 200P.
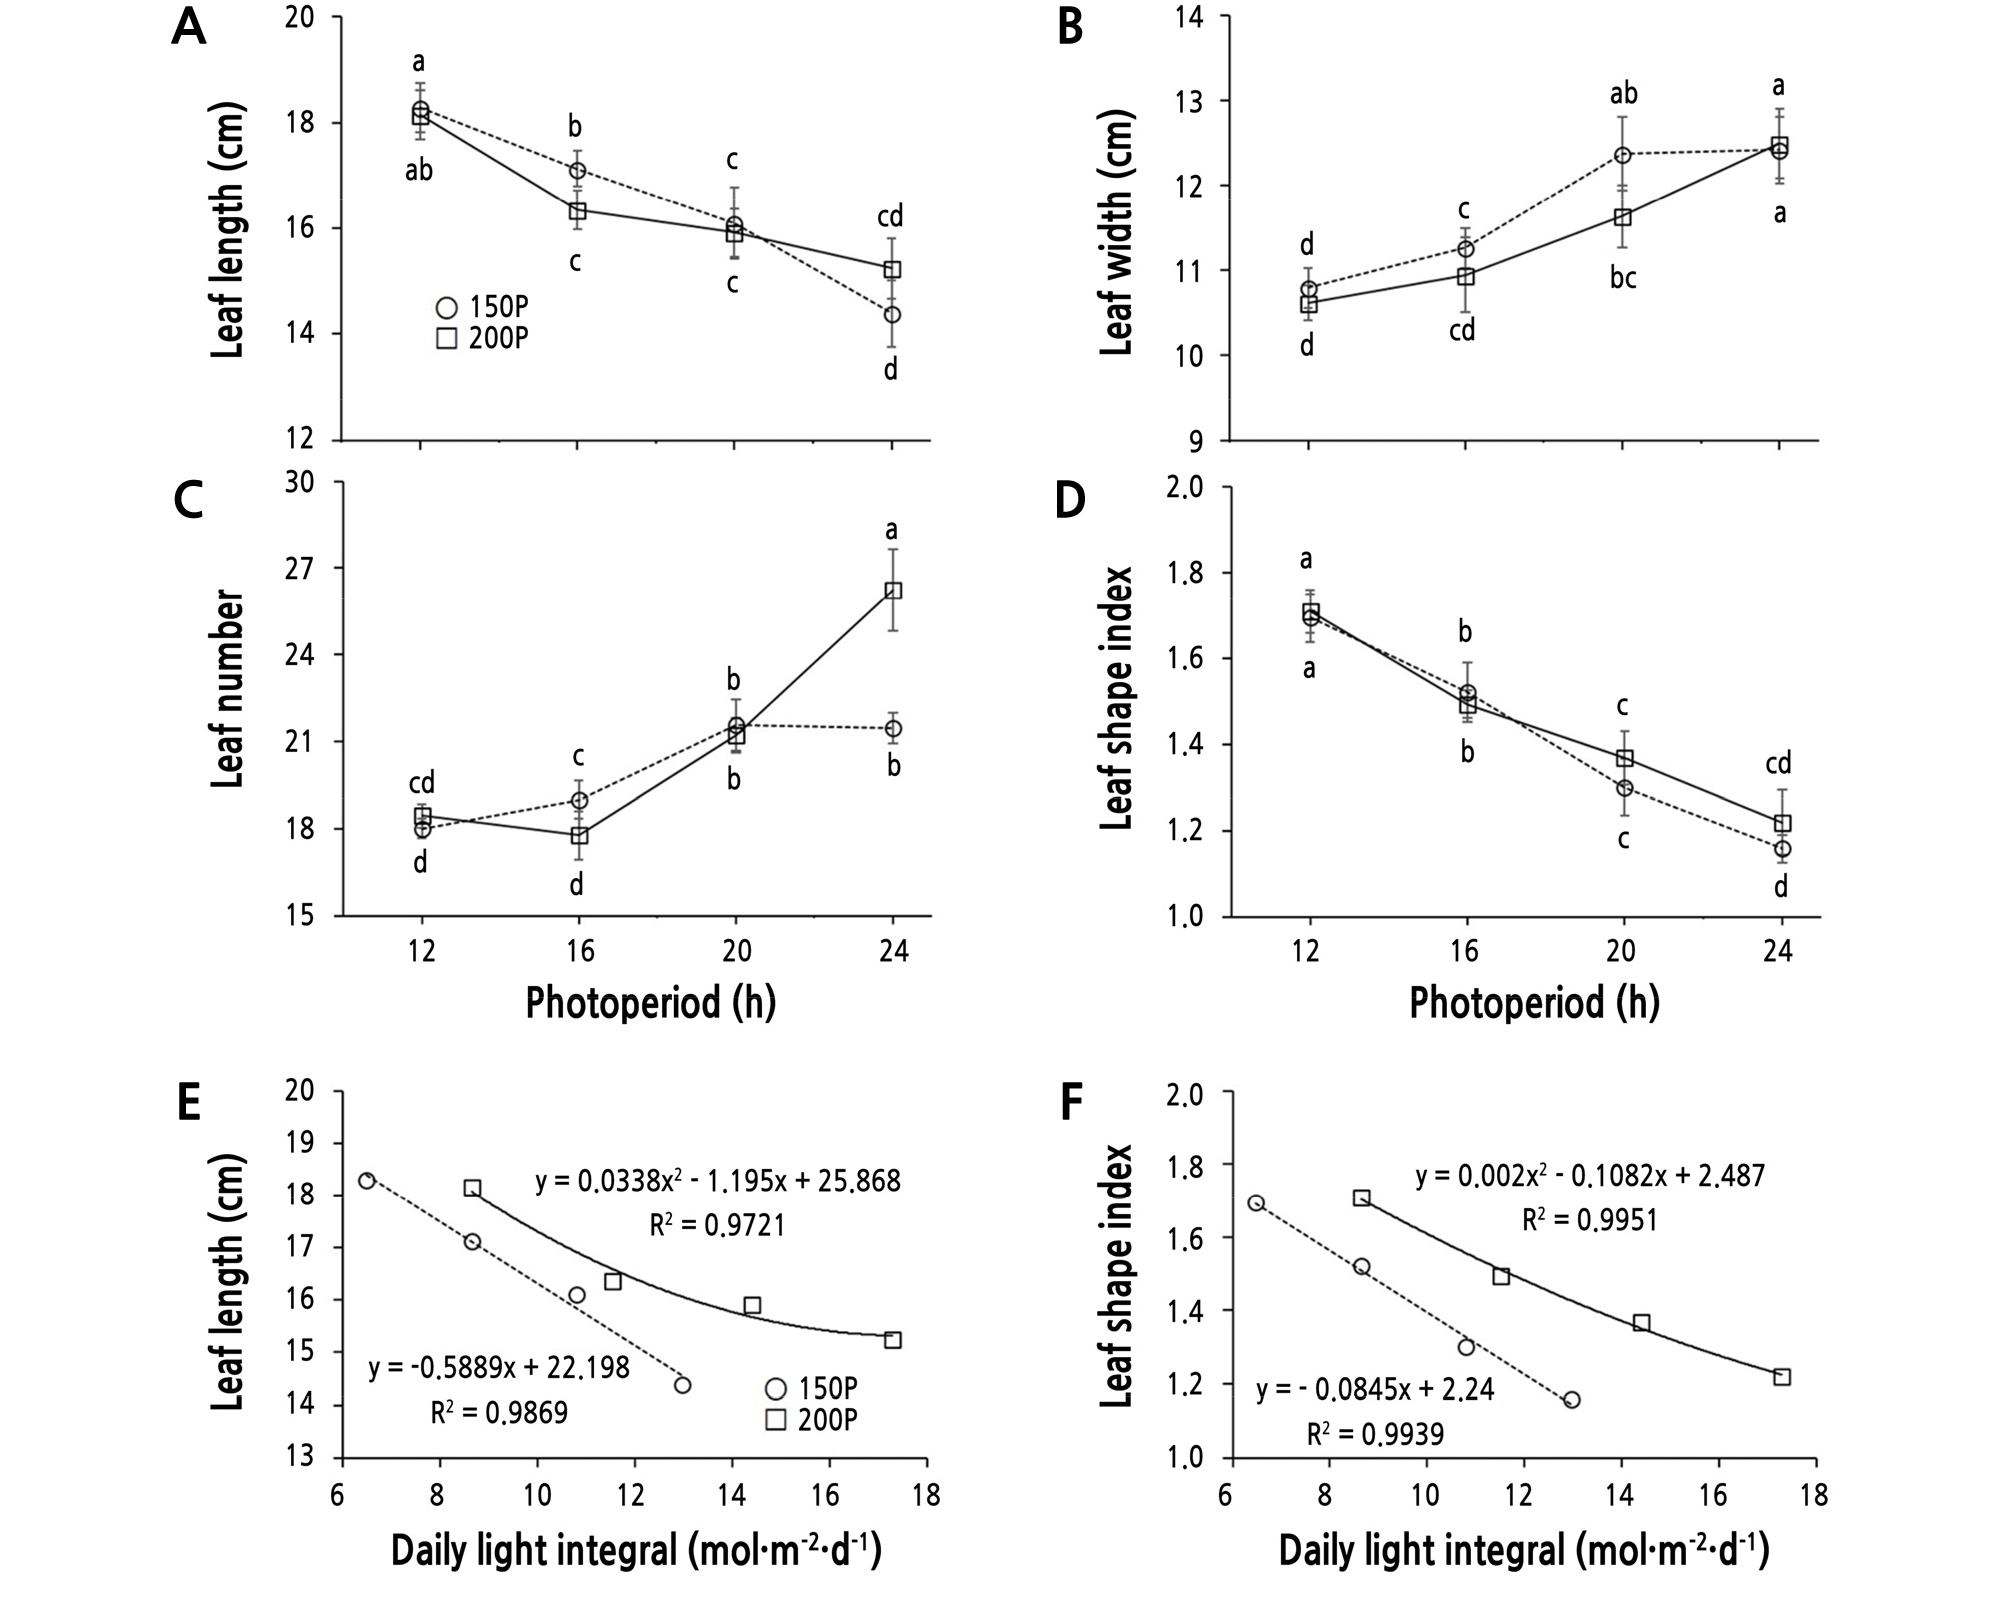
Fig. 3.
Leaf length (A), width (B), number (C), shape index (D, leaf length/width), and the relationships between the daily light integral and leaf length (E) or shape index (F) of ‘Cheongchima’ lettuce grown hydroponically under 150 (150P) or 200 (200P) µmol·m-2·s-1 PPFD and four photoperiods provided by external electrode fluorescent lamps (EEFLs) in a plant factory for 3 weeks. Vertical bars indicate the standard error (n = 9). Within-graph means followed by the same letter are not significantly different by Tukey’s honestly significant difference test at p ≤ 0.05.
Leaf shape also differed under varying photoperiods, with leaves tending to became elongated at shorter periods such as the 12 h period at both 200P and 150P (Fig. 3D). The leaf shape index also decreased as the photoperiod was extended, becoming broader and smaller at both 150P and 200P. The trend that the leaf shape index increases as photoperiod increases was reported in several plants such as chrysanthemum and Chenopodium (Thomas and Vince-Prue, 1997). The leaf length and leaf shape index decreased with increasing DLI in ‘Summer-Green’ lettuce (Kitaya et al., 1998), ‘Frill Ice’ lettuce (Yan et al., 2019a), and ‘Ziwei’ lettuce (Yan et al., 2019b). In this study, the leaf length and leaf shape index decreased as the DLI increased (Fig. 3E and 3F).
Leaf Area, Thickness, and SPAD Value
The leaf area was reduced at 200P, except at the 12 h and 16 h photoperiods, compared to 150P (Table 3 and Fig. 4A). There was a significant increase in leaf area under the 20 h photoperiod in the 150P light intensity, but there was a decreasing trend at 200P. The greatest and smallest leaf areas were observed in the 150P/20 h condition and the 200P/24 h condition, respectively. Within the 150P light intensity, there was no significant difference between the 12 h and 24 h photoperiods. Leaf area at 150P was slightly increased in the 20 h period, then showed a decreasing tendency at the 24 h period without a significant difference. Under the 200P light intensity, the trend was similar to that at 150P, but with a relatively greater magnitude. In general, the leaf area peaked under the 20 h period, then declined at the 24 h period under both light intensities. Adams and Langton (2005) reported that, of 50 species surveyed, 41 (82%) had increased leaf area or length in long day (LD) conditions, six (12%) had larger or longer leaves in short day (SD) conditions, and three (6%) showed no response in leaf extension. In other words, leaf area generally increases with increasing photoperiod. At the 24 h photoperiod, the leaf area at 150P (95.0 cm2) was 1.3-fold greater than that at 200P (72.3 cm2), which was in accordance with a previous study that reported that leaf area was decreased by increasing light intensity (Kitaya et al., 1998).
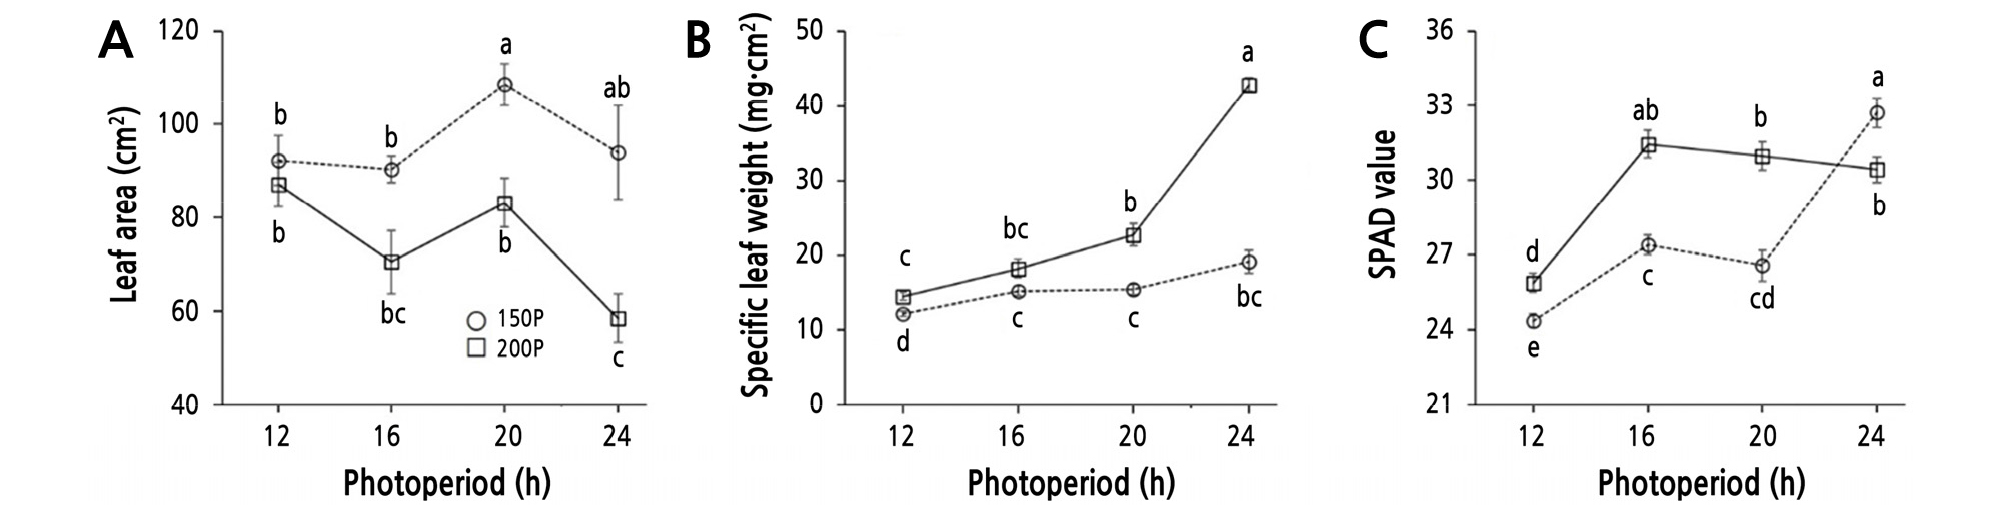
Fig. 4.
Leaf area (A), specific leaf weight (B), and SPAD value of ‘Cheongchima’ lettuce grown hydroponically under 150 (150P) or 200 (200P) µmol·m-2·s-1 PPFD and four photoperiods provided by external electrode fluorescent lamps (EEFLs) in a plant factory for 3 weeks. Vertical bars indicate the standard error (n = 9). Within-graph means followed by the same letter are not significantly different by Tukey’s honestly significant difference test at p ≤ 0.05.
The specific leaf weight (SLW), indicating the thickness of the leaf, increased as the photoperiod was extended, with the lowest values being observed in the 12 h photoperiod at both 200P and 150P (Fig. 4B). Between the 12 h and 24 h periods, there was a 2.4-fold increase at 200P and a 1.6-fold increase at 150P. These results indicated that the thickness of a leaf increased as the light intensity and photoperiod increased. Kitaya et al. (1998) reported that specific leaf area, a reciprocal of SLW, in lettuces decreased as the DLI increased. The doubling of irradiance increased the SLW by two-fold in lettuce (Chagvardieff et al., 1994).
The SPAD value for estimating chlorophyll content showed significant differences depending on the light intensity and photoperiod (Fig. 4C). Lettuce grown at 200P had a higher SPAD value (more chlorophyll content) than that grown at 150P under all photoperiods except for the 24 h period. The SPAD value was not increased further under photoperiods longer than 16 h at 200P, but was increased under the 24 h period at 150P. The LD treatment generally increased the chlorophyll content, which then promoted biomass accumulation (Adams and Langton, 2005).
These findings were similar to those reported by Inada and Yabumoto (1989), who found that chlorophyll content in ‘Okayama Saradana’ lettuce increased with increasing photoperiod under a PPFD of 320 µmol·m-2·s-1. A recent study showed that when ‘Romaine’ lettuce was grown under light intensities of 400, 600, and 800 µmol·m-2·s-1, the chlorophyll content decreased as light intensity increased, and the chlorophyll content, electron transport rate (ETR), and fresh weight were decreased under light intensities over 600 µmol·m-2·s-1 (Fu et al., 2012). In their study, the decrease in the ETR occurred from the elevation of non-photochemical quenching (NPQ), mainly caused by the destruction of photosynthetic organs in the lettuce leaves under an intensity of 800 µmol·m-2·s-1. In addition, ‘Grand Rapids’ lettuce grown under PPFDs of 100, 150, 200, and 250 µmol·m-2·s-1 showed increases in relative chlorophyll contents as the light intensity increased (Park et al., 1999). The light intensity in our experiment did not appear to destroy the photosynthetic organs of ‘Cheongchima’ lettuce, as indicated by the absence of a decrease in the chlorophyll content at 200P. This discrepancy was probably due to the difference in lettuce cultivars.
Total Phenolic Content and Antioxidant Level
The total phenolic content in the ‘Cheongchima’ lettuce showed a great difference under varying light intensities and photoperiods (Table 3 and Fig. 5A). The total phenolic content increased continuously when the photoperiod was extended at 150P. The phenolic content at the 24 h period was greatest at 150P, and was 5.3-fold greater than that at the 12 h period. Conversely, the total phenolic content increased between 12 h and 16 h at 200P, then decreased thereafter without a statistically significant difference with that at 16 h (Fig. 5A). In summary, the content peaked at the 16 h period.
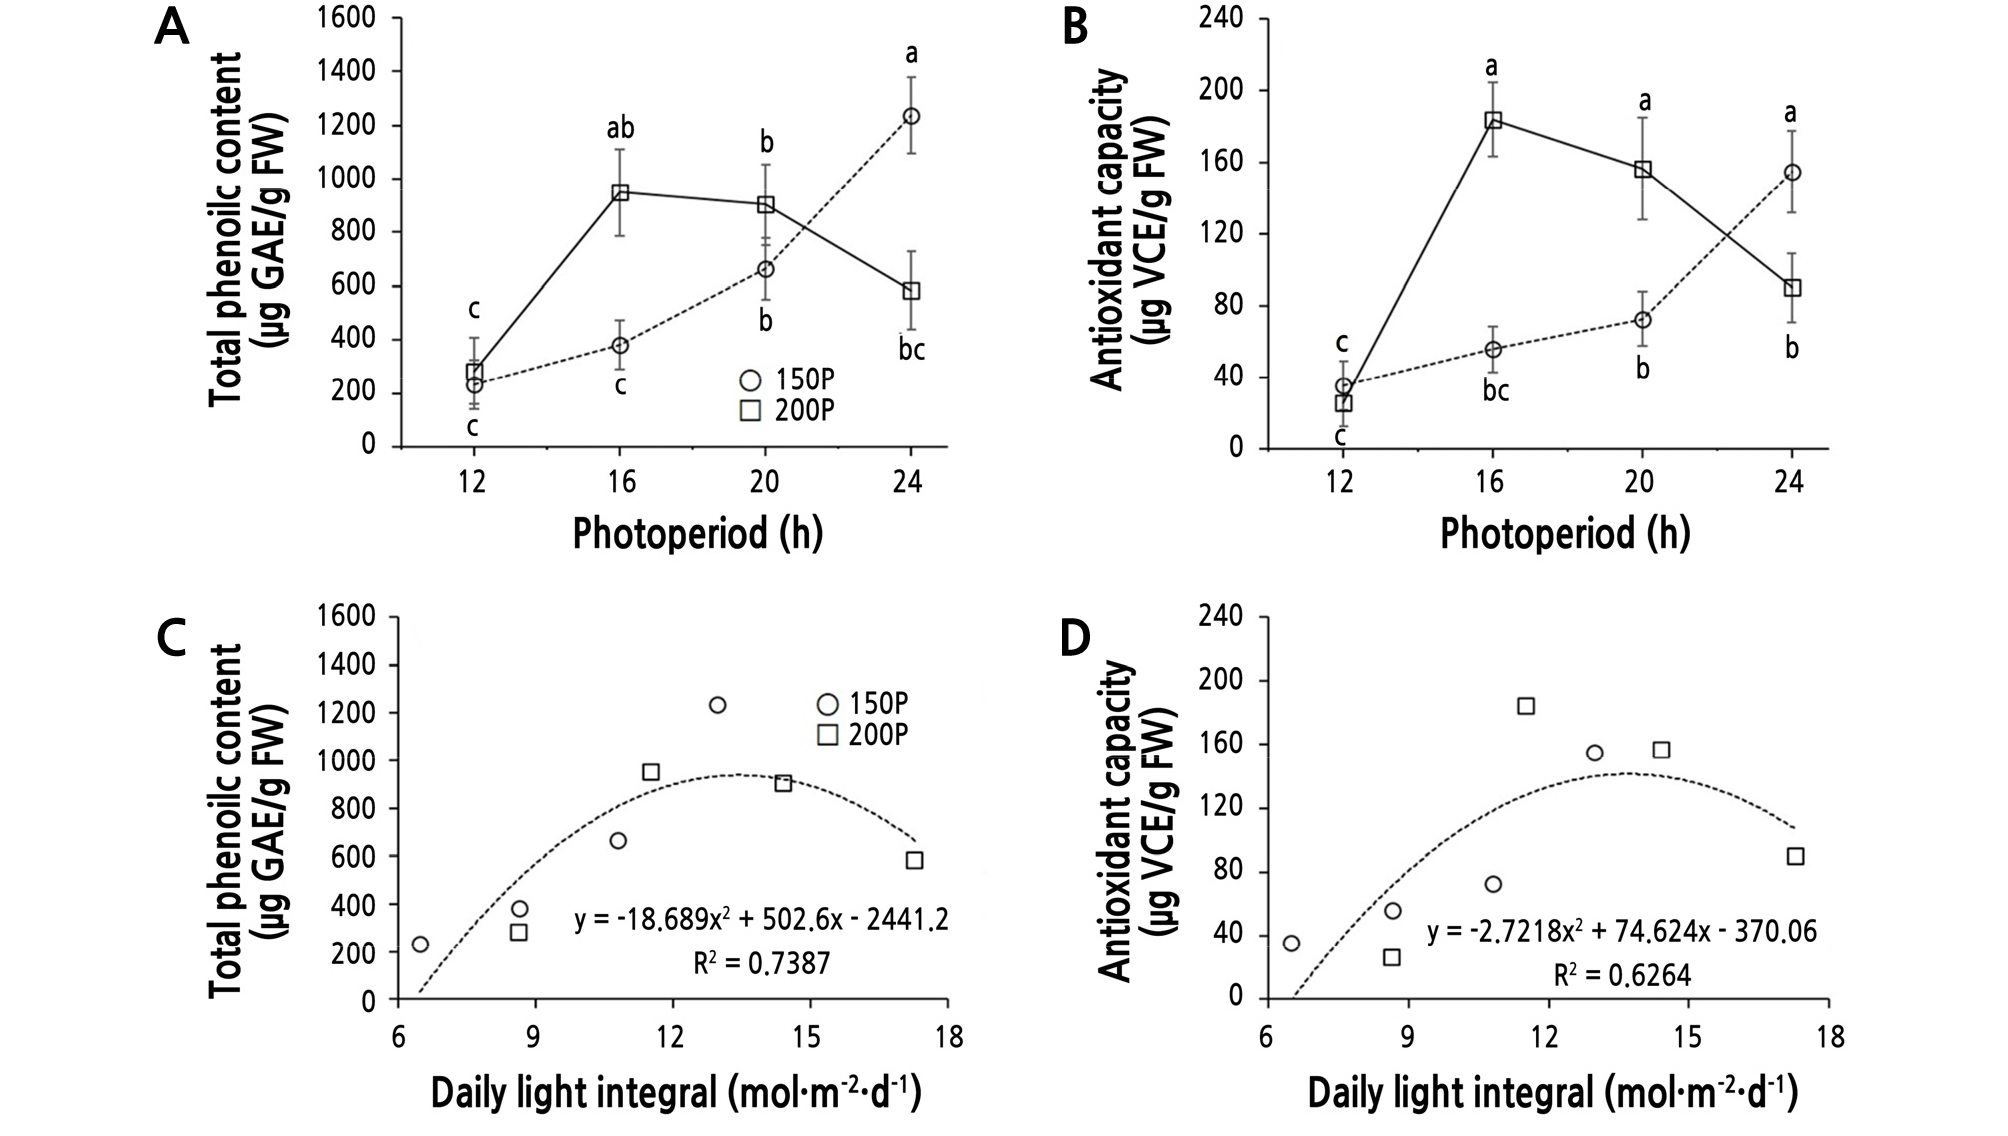
Fig. 5.
Total phenolic content (TPC, A), antioxidant capacity (AOC, B), and the relationships between the daily light integral (DLI) and TPC (C) or AOC (D) of ‘Cheongchima’ lettuce grown hydroponically for 3 weeks under 150 (150P) or 200 (200P) µmol·m-2·s-1 PPFD and four photoperiods provided by external electrode fluorescent lamps (EEFLs) in a plant factory. Vertical bars indicate standard error (n = 9). Within-graph means followed by the same letter are not significantly different by Tukey’s honestly significant difference test at p ≤ 0.05.
It has been reported that the total phenolic content and the antioxidant activity of Orthosiphon stamineus was greater under 0% shading than under 50% shading (Farhan et al., 2012). In the leaves of Ipomoea batatas, total phenolic content was greater at 16 h than at 8 h under a light intensity of 150 µmol·m-2·s-1 (Carvalho et al., 2010), which was consistent with the results of our experiment, in which the total phenolic content increased with increasing photoperiod at 150P. Under a 20-h photoperiod, the total phenolic content was not significantly higher at 200P than at 150P. Our data indicated that the total phenolic content might increase as photoperiod is extended under low light intensity, but could reach a saturation point under high light intensity.
The antioxidant capacity of the ‘Cheongchima’ lettuce also changed depending on the light intensity and photoperiod (Fig. 5B). The antioxidant capacity showed a similar tendency as that seen in the total phenolic content, increasing as the photoperiod increased at the 150P light intensity, but peaking at 16 h and then decreasing thereafter at the 200P light intensity. There was no significant difference among the 200P/16 h, 200P/20h, and 150P/24 h conditions.
Because approximately 70% of phenolic substances found in lettuce have shown antioxidant activity (Nicolle et al., 2004), the trends in total phenolic content and antioxidant level in this study might be similar to each other. The antioxidant activity of ‘Oak Leaf’ lettuce increased as the light intensity increased, while the total phenolic content and antioxidant level of Orthosiphon stamineus showed similar increases (Farhan et al., 2012; Pérez-López et al., 2013). This was probably due to differences in the response between cultivars of lettuce or species depending on light intensity. In this study, we found that the total phenolic content and accumulation of phytochemicals such as antioxidants in ‘Cheongchima’ lettuce changed depending on the light intensity and photoperiod.
These results can be inferred from the effects of the DLI, not the influence of light intensity or photoperiod, because regression analysis of the DLI on total phenolic content (TPC) or antioxidant capacity (AOC) showed a quadratic curve with a peak at 11.52 ‑ 14.40 mol·m-2·d-1 [TPC = ‑ 18.7 DLI2 + 502.6 DLI ‑ 2441.2 (R² = 0.74) and AOC = ‑ 2.7 DLI2 + 74.6 DLI ‑ 370.1 (R² = 0.63), respectively] (Fig. 5C and 5D).
Light Use Efficiency
Light use efficiency [LUE, mg DW per total integral light amount (mol)] at 150P showed a decreasing trend and was generally greater than at 200P (Fig. 6A). The LUE at the 200P light intensity was lowest in the 16 h photoperiod with no significant difference from the 12 h period, then increased toward the 24 h period, at which time it became similar to that of the 150P treatments. Lettuce grown at the 150P light intensity showed a decreasing trend with increased photoperiod and a higher or similar efficiency in all periods than those at 200P. In the 200P/24 h and 150P/24 h conditions, the LUE became similar to each other. In addition, there was a significant difference in the LUE between the 200P/12 h condition and the 150P/16 h condition, which had identical DLI values. And there were no significant differences between the 16 h and 20 h periods at 150P or the 12 h and 24 h periods at 200P (Fig. 6A).
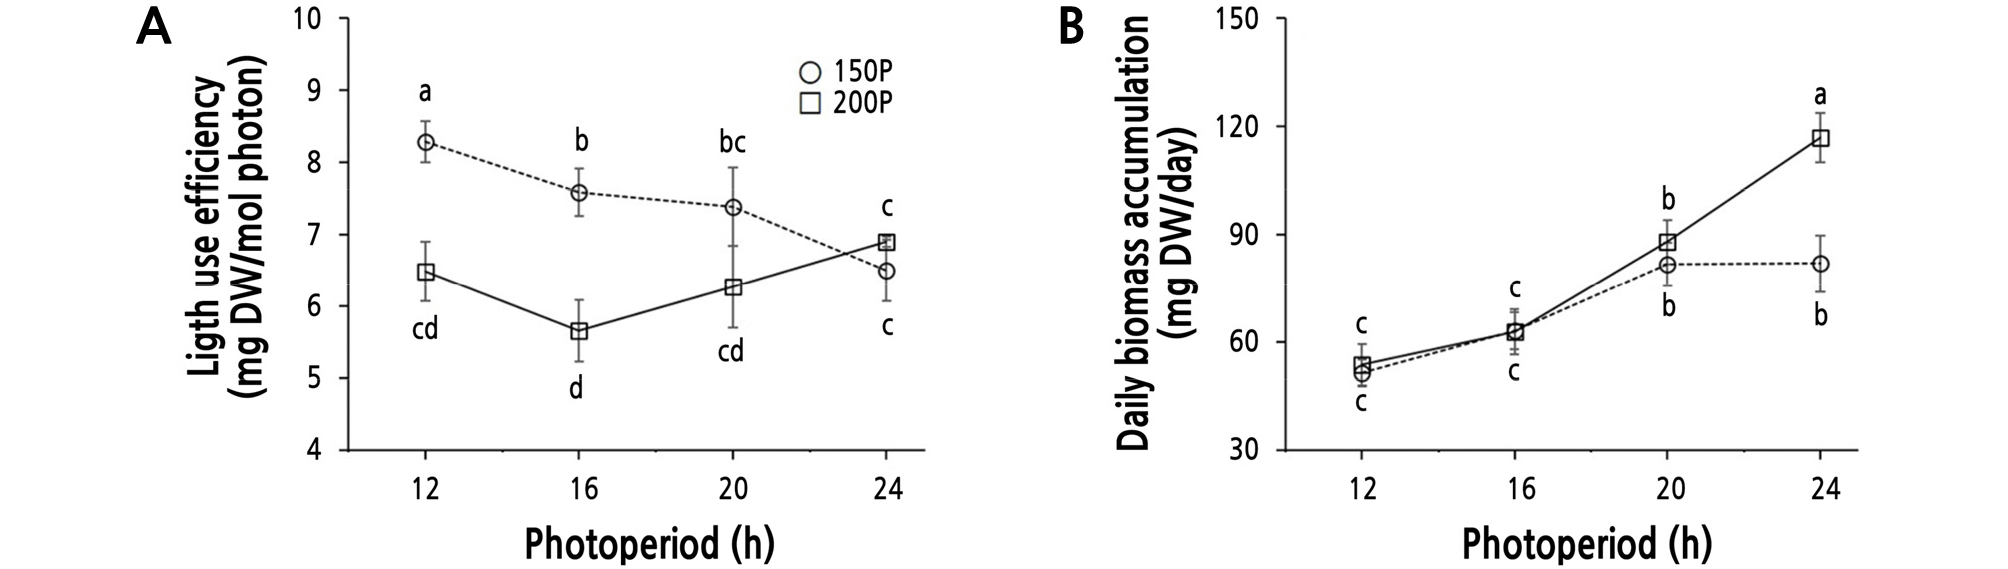
Fig. 6.
Light use efficiency (A) and daily biomass accumulation rate (B) of ‘Cheongchima’ lettuce grown hydroponically for 3 weeks under 150 (150P) or 200 (200P) µmol·m-2·s-1 PPFD and four photoperiods provided by external electrode fluorescent lamps (EEFLs) in a plant factory. Vertical bars indicate the standard error (n = 9). Within-graph means followed by the same letter are not significantly different by Tukey’s honestly significant difference test at p ≤ 0.05.
In Achimenes, growth metrics such as plant length, leaf dry weight, leaf area, and leaf number were higher under the LL than the HL condition under the same DLI value, and the LUE was higher under the LL and long photoperiod condition (Vlahos et al., 1991). A similar trend was also found in this study, although the ranges of light intensities and photoperiods were not large in the present study. LUEs calculated from shoot dry weight of ‘Hongyeom Jeockchukmyeon’ lettuce were 8.86, 5.69, 4.53, and 5.29 mg DW/mol photons at 200, 230, 260, and 290 µmol·m-2·s-1 PPFD, respectively, under an 18 h photoperiod provided by LEDs (R:B:W = 8:1:1) for 35 days (Kang et al., 2013), showing that LUE decreased with increasing light intensity. In addition, the LUE values of lettuce grown under LEDs (Kang et al., 2013) were very similar to those of this study (5.66 ‑ 8.28 mg DW/mol photons) (Fig. 6A). LUEs calculated from shoot dry weights of ‘Seonhong Jeockchukmyeon’ lettuce ranged from 8.41 to 11.57 mg DW/mol photons under 100 µmol·m-2·s-1 PPFD for 22 days (Park et al., 2012), showing that LUE is relatively higher under low light intensity. It is inferred that the higher LUE under the lower light intensity may be due to the relatively larger slope of the photosynthetic curve at the lower PPFD.
The reported light saturation point of lettuce has varied among different studies, ranging from 500 to 520 µmol·m-2·s-1 (Glenn et al., 1984) to 889 ‑ 932 µmol·m-2·s-1 (Knight and Mitchell, 1983a, 1983b). The light level of the present study was substantially lower than these light saturation points. However, the LUE was greatest when the lettuce was grown under the 150P/12 h condition with the lowest DLI. And the LUEs of Achimenes, ‘Hongyeom Jeockchukmyeon’ lettuce, and ‘Ziwei’ lettuce were relatively higher under the 150P and long photoperiod condition when the DLI was the same (Vlahos et al., 1991), a lower PPFD when the photoperiod was the same (Kang et al., 2013), a lower PPFD from FLs and LEDs (Zhang et al., 2018), and a lower DLI under various red to blue ratios of LEDs (Yan et al., 2019b), respectively.
Optimal Production Condition
Although the LUE was highest when lettuce was grown under the 150P/12 h condition (Fig. 6A), it took more time to produce a sellable plant than the 200P/24 h condition, in which the daily biomass accumulation rate was highest (Fig. 6B) and could increase the production turnover rate. Lettuce grown under a 24 h photoperiod had increased fresh weight, dry weight, and leaf area relative to that grown under the 16 h photoperiod, and the electricity cost per unit weight was reduced by 10% (Ohyama et al., 2005). However, the 24 h photoperiod had some disadvantages. Specifically, the LUE under the 24 h period was lower than that under 20 h of illumination in the ‘Okayama Saradana’ lettuce (Inada and Yabumoto, 1989), and the 200P/24 h condition in the present study resulted in a smaller leaf area and decreased total phenolic content, indicating reduced commercial value of the plant, phytochemical content, and antioxidant activity. The lettuce grown under the 150P/20 h condition showed a relatively high LUE value, a high daily biomass accumulation rate, and preferred leaf shape and size, resulting in high commercial value.
In the present study, the growth response of ‘Cheongchima’ lettuce was investigated according to light intensity and photoperiod using EEFLs as an artificial light source in a closed plant production system because EEFLs have a higher red to blue ratio than the widely-used FLs and have a similar R:B ratio (7:3) recommended by LED studies (Fig. 1 and Table 1), and are cheaper than LEDs. However, this study has limitations in that a control treatment with LEDs with a similar R:B ratio was not tested with EEFLs. In addition, EEFLs dissipate more heat than LEDs. Therefore, the validity period of EEFLs may not be as long.
During cultivation of ‘Cheongchima’ lettuce, the 150P/20 h condition resulted in relatively good growth, high LUE, and effectively increased the production turnover rate via reduced production time. Accordingly, these conditions were determined to be appropriate for the plants investigated in this study. Yan et al. (2019a) recommended a PPFD of 200 µmol·m-2·s-1 with a 16-h photoperiod (11.52 mol·m-2·d-1 DLI) provided by LEDs with a R:B ratio of 2.2 for seedling production of the green lettuce ‘Frill Ice’ hydroponically grown in a plant factory. We recommend a PPFD of 150 µmol·m-2·s-1 with a 20-h photoperiod (10.80 mol·m-2·d-1 DLI) provided by EEFLs (R:B = 2.2) for ‘Cheonchima’ lettuce production based on the results of this study, despite some limitation. Based on these findings, future studies using various light intensities, photoperiods, and identical DLIs between different photoperiods are warranted to enable a better understanding of the growth pattern and identification of improved conditions for the production of lettuce. Increasing the DLI increased growth and improved quality attributes of lettuce, whereas the specific combination of photoperiod and PPFD can have different effects on plant growth and quality (Kelly et al., 2020). Therefore, further studies to investigate the effects of higher PPFD and photoperiod combinations compared to this study are needed.
