

Introduction
Materials and Methods
Experimental Device
Image Acquisition
Pre-processing of a RGB Image
Fire Blight Learning Algorithm
Image Learning Similarity Evaluation
Fire Blight Analysis Data Set
Results and Discussion
Learning Using a Fire Blight Simulation Branch
Detection of a Fire Blight Simulation Branch
Detection of Branches of Fire Blight
Conclusions
Introduction
Fruit tree fire blight first occurred in New York in 1780 and has since occurred in many parts of the world, including Europe and Central Asia (Calzolari et al., 1999; Bahadou et al., 2018; Zhao et al., 2019). This disease is caused by Erwinia amylopora, a bacterial pathogen, and is a highly contagious fruit tree disease that causes black-brown decay of branches, berries, and leaves, on fruit trees such as apples and pears (Jeong et al., 2018). There is currently no treatment for fire blight, and the disease is difficult to control, especially since the pathogen is easily spread to nearby trees by bees and splashing rain and has a long incubation period. In addition, if the presence of the disease is confirmed, the damage to the orchard can be very serious because all of the trees within a radius of 100 meters must be buried in accordance with the 'Guidelines for Preventing Fire Blight' based on (Preparation and Prevention Act 36). In Korea, fire blight occurred in 43 orchards in Anseong and Cheonan in 2015, 8 orchards in 2016, and 17 orchards in 2017, resulting in the destruction of trees over an area of about 103 ha (Park et al., 2017). According to the Rural Development Administration, as of June 2020, fire blight incidences were reported in 312 farms and an area of 187 ha. In Korea, copper-based compounds and antibiotics such as kasugamycin and oxyttracycline, or antagonistic microorganisms are used to prevent fire blight (McGhe and Sundin, 2011; Lee et al., 2018).
The study on fire blight detection was intended to make a strip-type diagnostic kit using locally separated Erwinia amylopora strains, check the specificity and sensitivity of the domestic fire blight pathogens in this diagnostic kit and a diagnostic kit already commercialized in Europe, and examine the possibility of application in field diagnosis of orchard fire blight (Heo et al., 2017). There are also improved loops for diagnosis of apple and pear fire blight (Shin et al., 2018) and research on selection of in-flight test repellents for orchard disease in Korea (Lee et al., 2018). Also, there is a possibility of future infection in Korea by using Maryblyt, which is windows application used in the U.S., Israel, Spain, Canada, and Switzerland to study and prevent fire blight. Most of the existing studies were field-diagnostic and environmental-induced on-site studies. In the case of on-site diagnostics, all the pear trees in the orchard must be investigated to determine the incidence of fire blight, which requires large inputs of manpower, time, and cost. Precision forecasts of a single orchard are difficult because prediction by environmental factors establishes and predicts the likelihood of occurrence in a wide range of areas. Therefore, it is imperative to develop technologies that can reduce the manpower, time, and cost of predicting fire blight by remotely monitoring orchards and performing on-site diagnostics.
Artificial intelligence (AI) is also widely used by many researchers for plant growth and nonlinear data processing (Nam et al., 2019; Moon et al., 2020). A Convolutional Neural Network (CNN) is an algorithm useful for finding patterns to analyze images, and CNNs learn directly from data and classify images using patterns. The core concept of a CNN is to learn by maintaining spatial data in images. CNNs handle images more effectively by applying filtering techniques to artificial neural networks (Yann et al., 1998). In medical image segmentation, lots of researchers have used CNNs (Ronneberger et al., 2015; Litjens et al., 2017). They used a U-Net, which is similar to SegNet, and consists of an encoder and a decoder network. U-Net is very useful in segmenting medical images, U-Net and U-Net-like models have been used in many biomedical areas, such as neuronal structures (Ronneberger et al., 2015), liver (Christ et al., 2016), and skin lesion (Lin, 2017), etc.
Therefore, in this study, the RGB images were acquired using rotary-wing drones and RGB sensors, and the detection status of fire blight was analyzed using the CNN of Deep Learning, and then a system was developed to predict the occurrence of fire blight on the site. The performance of the fire blight forecast system was evaluated by applying it to actual fire blight images.
Materials and Methods
Experimental Device
Fig. 1 and Table 1 show the specifications of a rotary-wing drone and specifications for image acquisition in areas where fire blight occur. As shown in Fig. 1, the image of pear fire blight was acquired using the data acquisition platform of the Rotary-wing Drone DJI Company Phantom4 Pro V2.0.
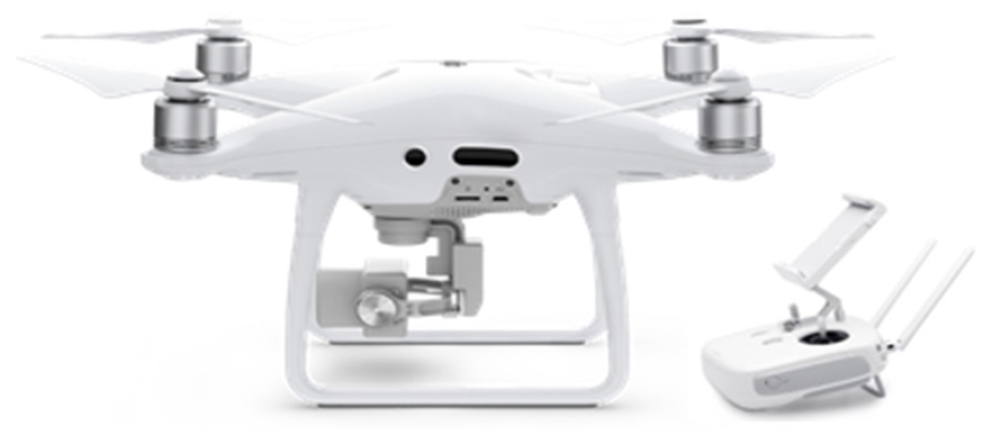
Table 1.
Specifications of DJI Phantom4 Pro V2.0 Rotary-winged drone
| Model | DJI Phantom4 Pro V2.0 |
| Company | DJI |
| Weight | 1,388 g |
| Sensing distance | 30 m |
| Control distance | 7 km |
| Flight speed | 50 ‑ 72 km/h |
| Flight time | 55 min |
Fig. 2 and Table 2 show the sensors and specifications for obtaining images of pear fire blight. As shown in Fig. 2, the sensor for acquiring the image data for pear fire blight was a 1" 20 MP RGB Sensor (DJI Phantom4 Pro V2.0 Camera). In addition, the video acquisition software used was the DJI GO4 application. DJI GO4 sets the flight altitude and overlay shooting area of the rotary-wing drone to create an autonomous flight path, and it is possible to set the shooting area display and landing.
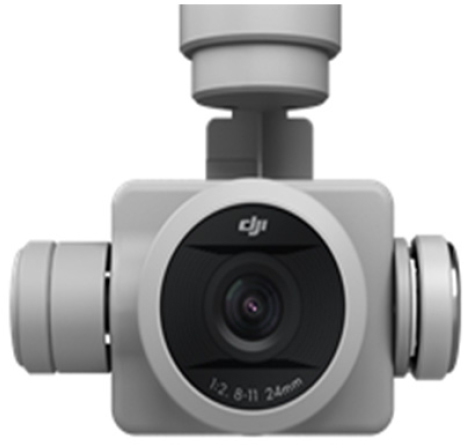
Table 2.
Specifications of DJI Phantom4 Pro V2.0 camera
| Model | DJI Phantom4 Pro V2.0 camera |
| Company | DJI |
| Sensor resolution | 20 MP |
| Image resolution | 5,472 pixels × 3,648 pixels |
| Band | Red, Green, Blue |
Image Acquisition
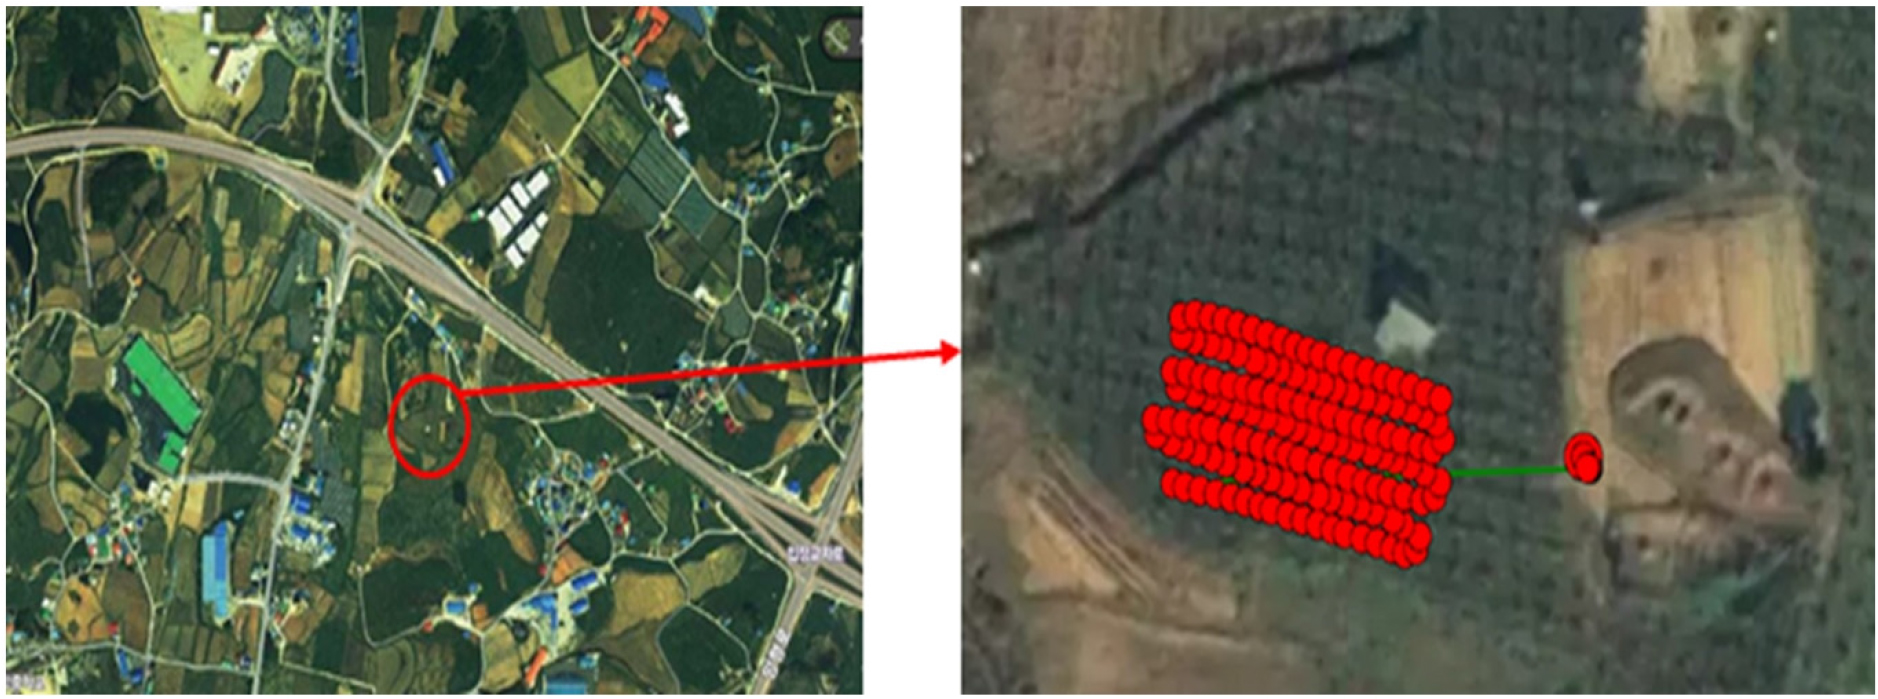
Actual pear fire blight images (fire blight outbreak in a pear orchard in Ipjang-myeon, Cheonan-si, Chungcheongnam-do, Korea, June 2018) were acquired at an altitude of over 6 m. The spatial resolution was 0.11 cm/pixel. In order to increase the precision and reliability of fire blight detection machine learning, a fire blight branch model for simulation was also installed in the orchard following the advice of a disease expert in Naju pear research center. The simulation images of fire blight were obtained at an altitude of over 12 m. The spatial resolution was 0.32 cm/pixel.
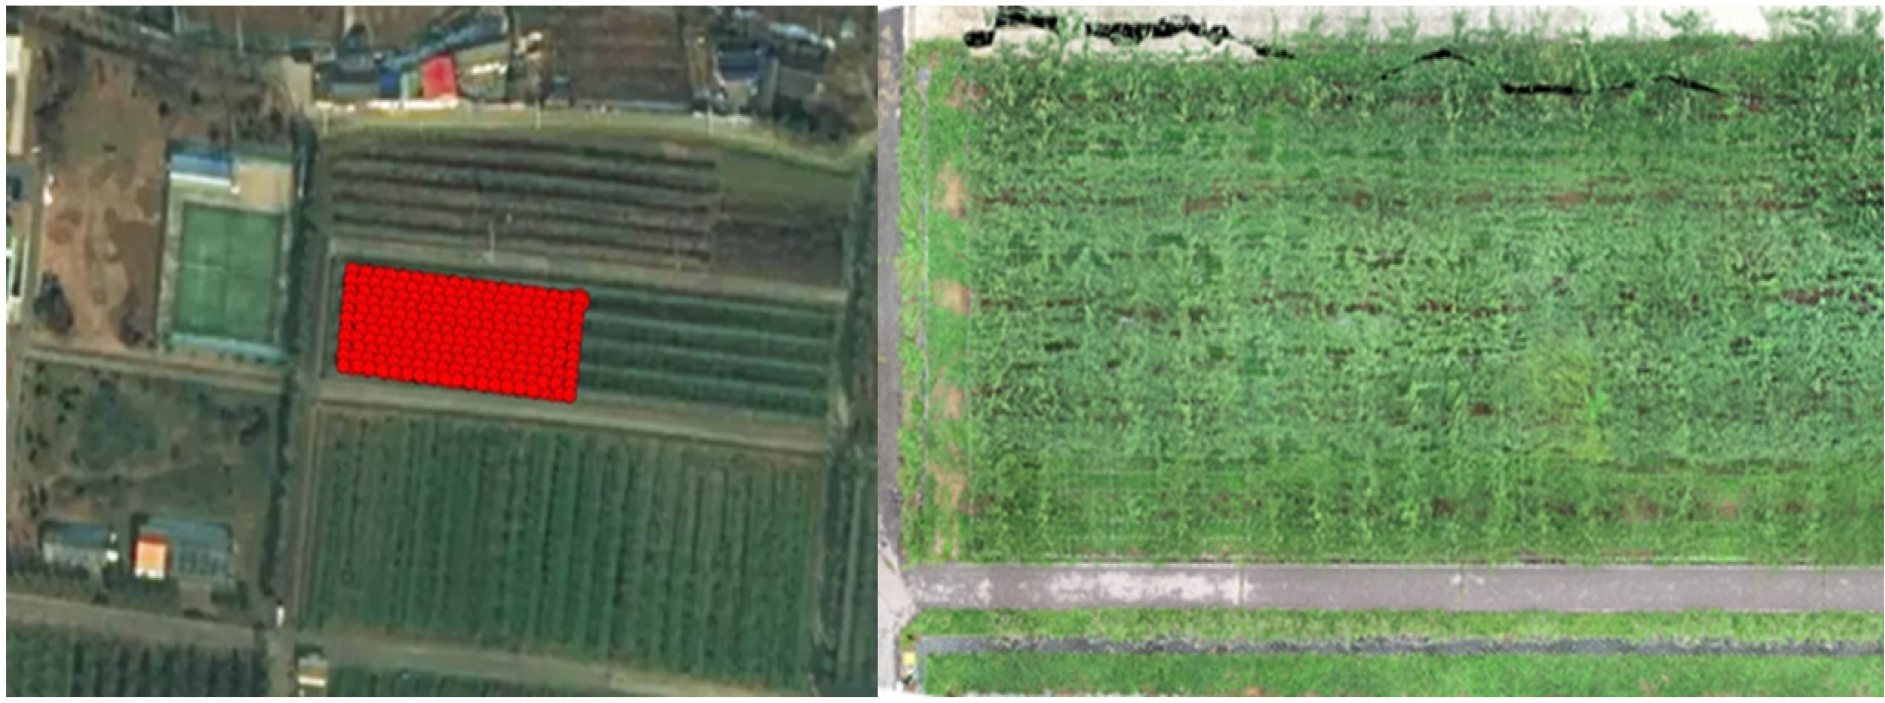
Fig. 3 shows the location of an orchard in Cheonan, South Chungcheong Province, where the actual pear fire blight occurred, and the autonomous flight path of the drone. Fig. 4 shows the flight path of a rotary-wing drone and a regular image of the orchard at the pear lab in Naju, South Jeolla Province.
Pre-processing of a RGB Image
Fig. 5 shows the image preprocessing process for deep-learning analysis of the image of pear fire blight.
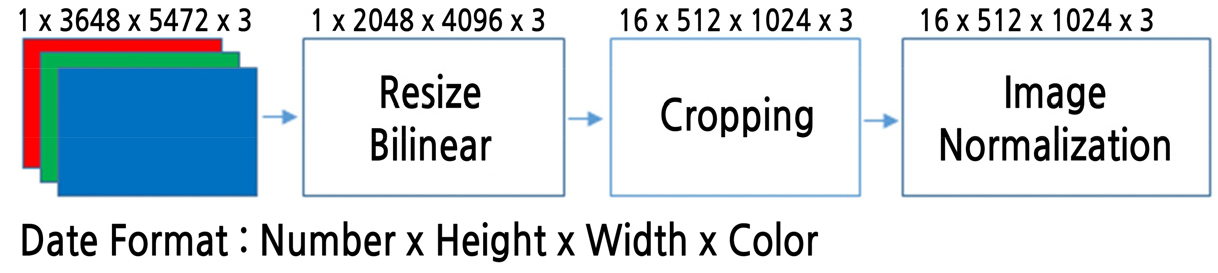
As shown in Fig. 5, images acquired with a 1" 20 MP RGB camera mounted on a DJI Phantom4 Pro V2.0 drone were obtained with 5,472 pixels × 3,648 pixels. The pre-processing of the image was performed after compressing the acquired images to 2,048 pixels × 4,096 pixels and dividing the compressed images into 16 images by 512 pixels × 1,024 pixels for normalization.
Fire Blight Learning Algorithm
Fig. 6 shows the RGB image segmentation algorithm for fire blight using Deep Learning's CNN. The fire blight RGB image analysis algorithm and graph creation used Tensorflow (US 1.2.1, Google, Menlo Park, USA), a library of numerical calculations based on the programming language Python.

The CNN architecture consists of image input layer, convolution layer, batch normal layer, ReLU layer, max pooling layer, transpose convolution layer, and sigmoid layer. In particular, batch normal layer was applied to improve the performance of detection of fire blight images (Ji et al., 2018). Batch normalization is one of the proposed methods for solving the problem of the network's Internal Covariate Shift, which is to normalize the unit output of the mini-batch pass through each Affine layer into a standard regular distribution. In this paper, the average () and the variance () of the minibatch were calculated and normalized () based on its value, the scale and shift () were performed, and equations (1,2,3,4,5,6) were as follows. (Ioffe and Christian, 2015).
Image Learning Similarity Evaluation
In this study, the similarity coefficient was used as one of the methods of assessment based on overlap. The Dice similarity coefficient is defined in equation (6) indicating its similarity by directly comparing the results of the automatic detection with the gold standard image directly detected by the naked eye (Kim and Kim, 2017).
where and represent the segmented region of interest in the gold standard image and the auto-detection image, respectively.
The component of the error sequence , , , and are True Positive, False Positive, True Negative, and False Negative, respectively; those values are defined through Equations (7,8,9,10) by using the segmentation function and .
where and are the split allocation function of the gold standard image and the auto detect image, respectively, and the function value is defined as 1, if (0, 1), and 0 if ∉(0.1) in the gold standard image, 1 if (0, 1), and 0 if ∉(0.1) in the auto detect image. Also, =1 means the region of split interest, =2 means a background other than the region of interest. Additionally, using the Adam Optimizer, we optimized the learning variables of the graph according to the DICE loss value.
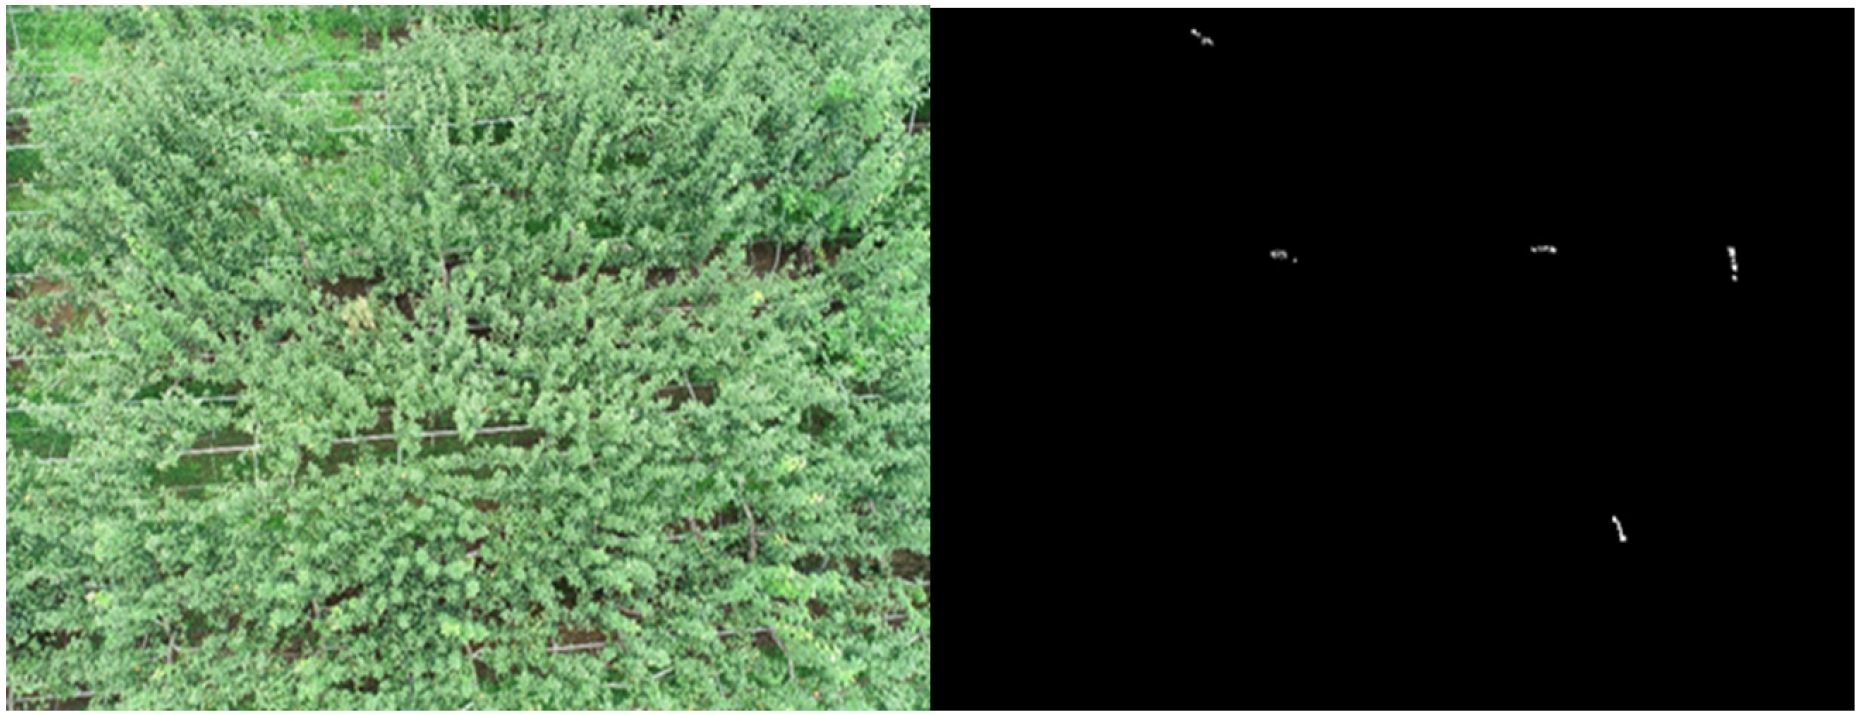
Fig. 7 shows the original image and gold standard image used in image segmentation.
Fire Blight Analysis Data Set
Table 3 shows the data sets for the analysis of fire blight. 131 images out of a total of 231 simulation images were used for training and 100 images were used for learning results evaluation.
Table 3.
Data set for fire blight analysis
| Item | Total | Training | Evaluation |
| Fire blight simulation | 231 | 131 | 100 |
| Fire blight | 140 | 100 | 40 |
In the case of actual fire blight images, 100 images of the total of 140 images were used for training and 40 were used for learning results evaluation.
Results and Discussion
Learning Using a Fire Blight Simulation Branch
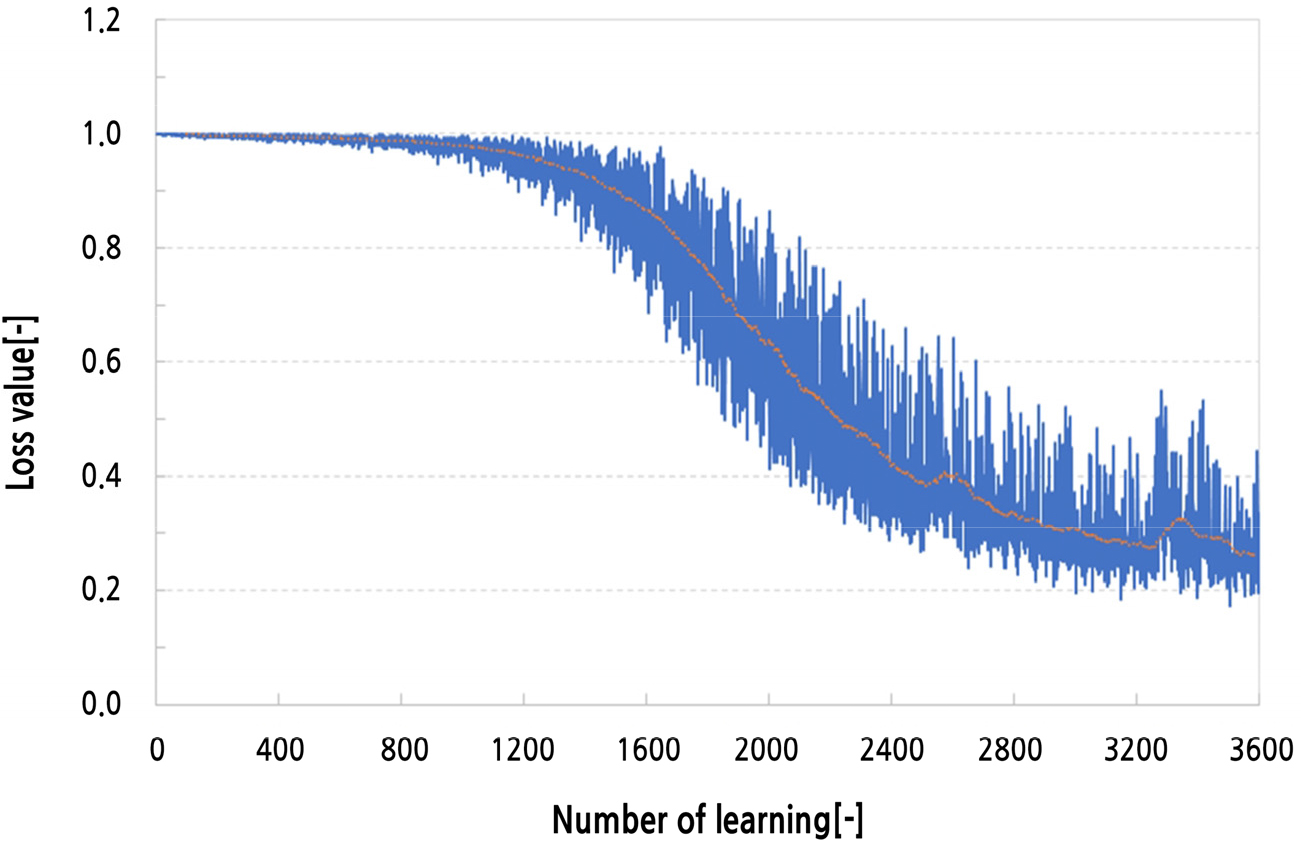
Fig. 8 illustrates the learning loss value of overlap-based fire blight imaging simulations using the Dice function. The number of studies using simulation images was performed 3,600 times, and errors were performed based on an average of 22% to prevent overfitting of the image data.
Detection of a Fire Blight Simulation Branch
Fig. 9 shows a still image acquired with a 1" 20 MP RGB camera at an altitude of 12 m and the result of detecting fire blight by deep learning.
As shown in Fig. 9, the area marked by a red ellipse is the site of onset of fire blight and detection by deep learning shows that the area of fire blight can be detected accurately. In particular, as shown in the enlarged image, it was possible to detect the ground shading and a dried branch of an orchard similar in color to that of a fire blight-infected branch without recognizing it as fire blight. However, there were also cases in which very small shaded areas of a normal branch were mis-detected, as seen in Fig. 10.
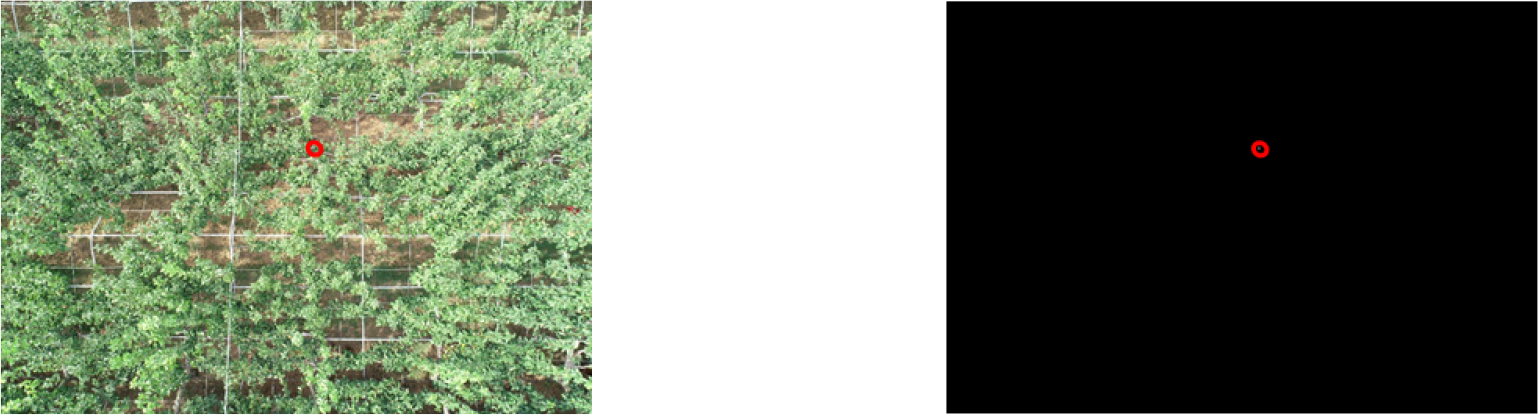
Table 4 shows the learning results of the pear's RGB image taken at an altitude of 12 meters. For fire blight simulation branch learning 131 images of fire blight simulation were used.
Table 4.
Results of the detection of a fire blight simulation using the CNN learning method in deep learning
| Confusion matrix | Prediction | Total | Prediction ratio (%) | ||
| Infection | No-infection | ||||
| Actual | Infection | 64 | 16 | 80 | 80.0 |
| No-infection | 1 | 19 | 20 | 95.0 | |
As shown in Table 4, 100 images were used for the training test, which consisted of 80 images of fire blight-infected fruit trees and 20 images of non-infected fruit trees.
As a result, 64 of the 80 images of the fruit tree infected with fire blight were recognized as an infection while 16 images were recognized as non-infected, resulting in an 80.0% prediction rate. In addition, in the test results of 20 non-infected images, 19 images were recognized as non-infected, and 1 image was recognized as infected, showing a 95.0% prediction rate. Therefore, it is believed that Deep Learning's CNN algorithm, which was developed in this study, can be applied sufficiently to detect pear fire blight.
Detection of Branches of Fire Blight
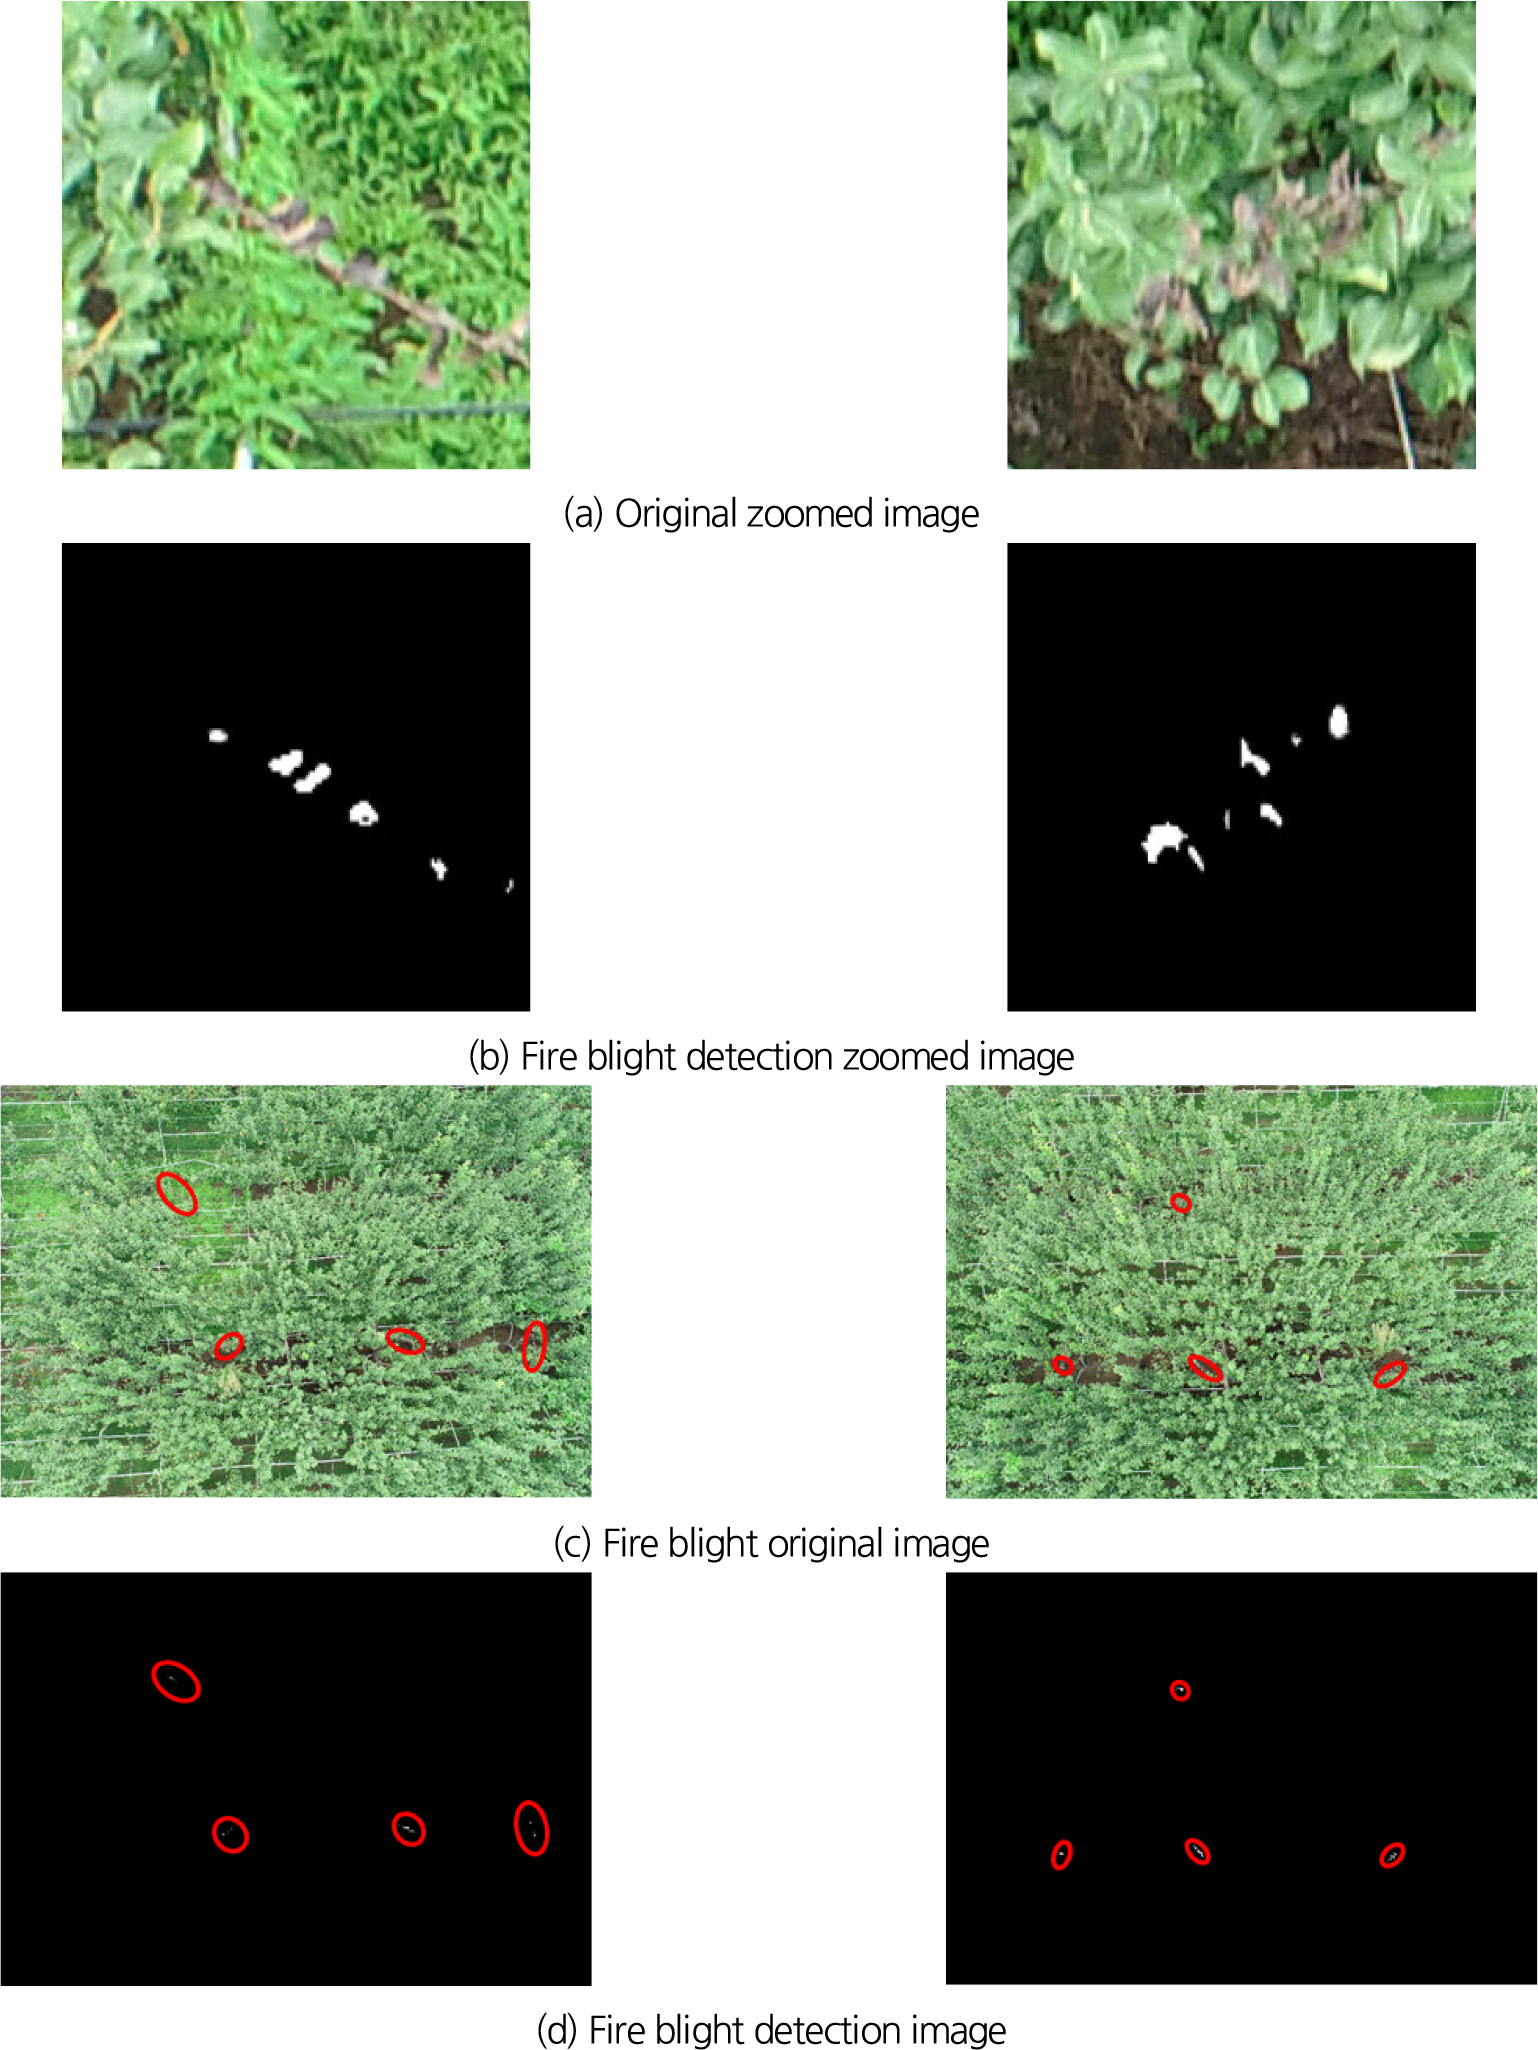
Fig. 11 shows the results of the detection by the size of each occurrence of fire blight after learning the actual fire blight incidence images acquired with a 1" 20 MP RGB camera at an altitude of 6 meters using the same algorithm as the fire blight simulation analysis algorithm.
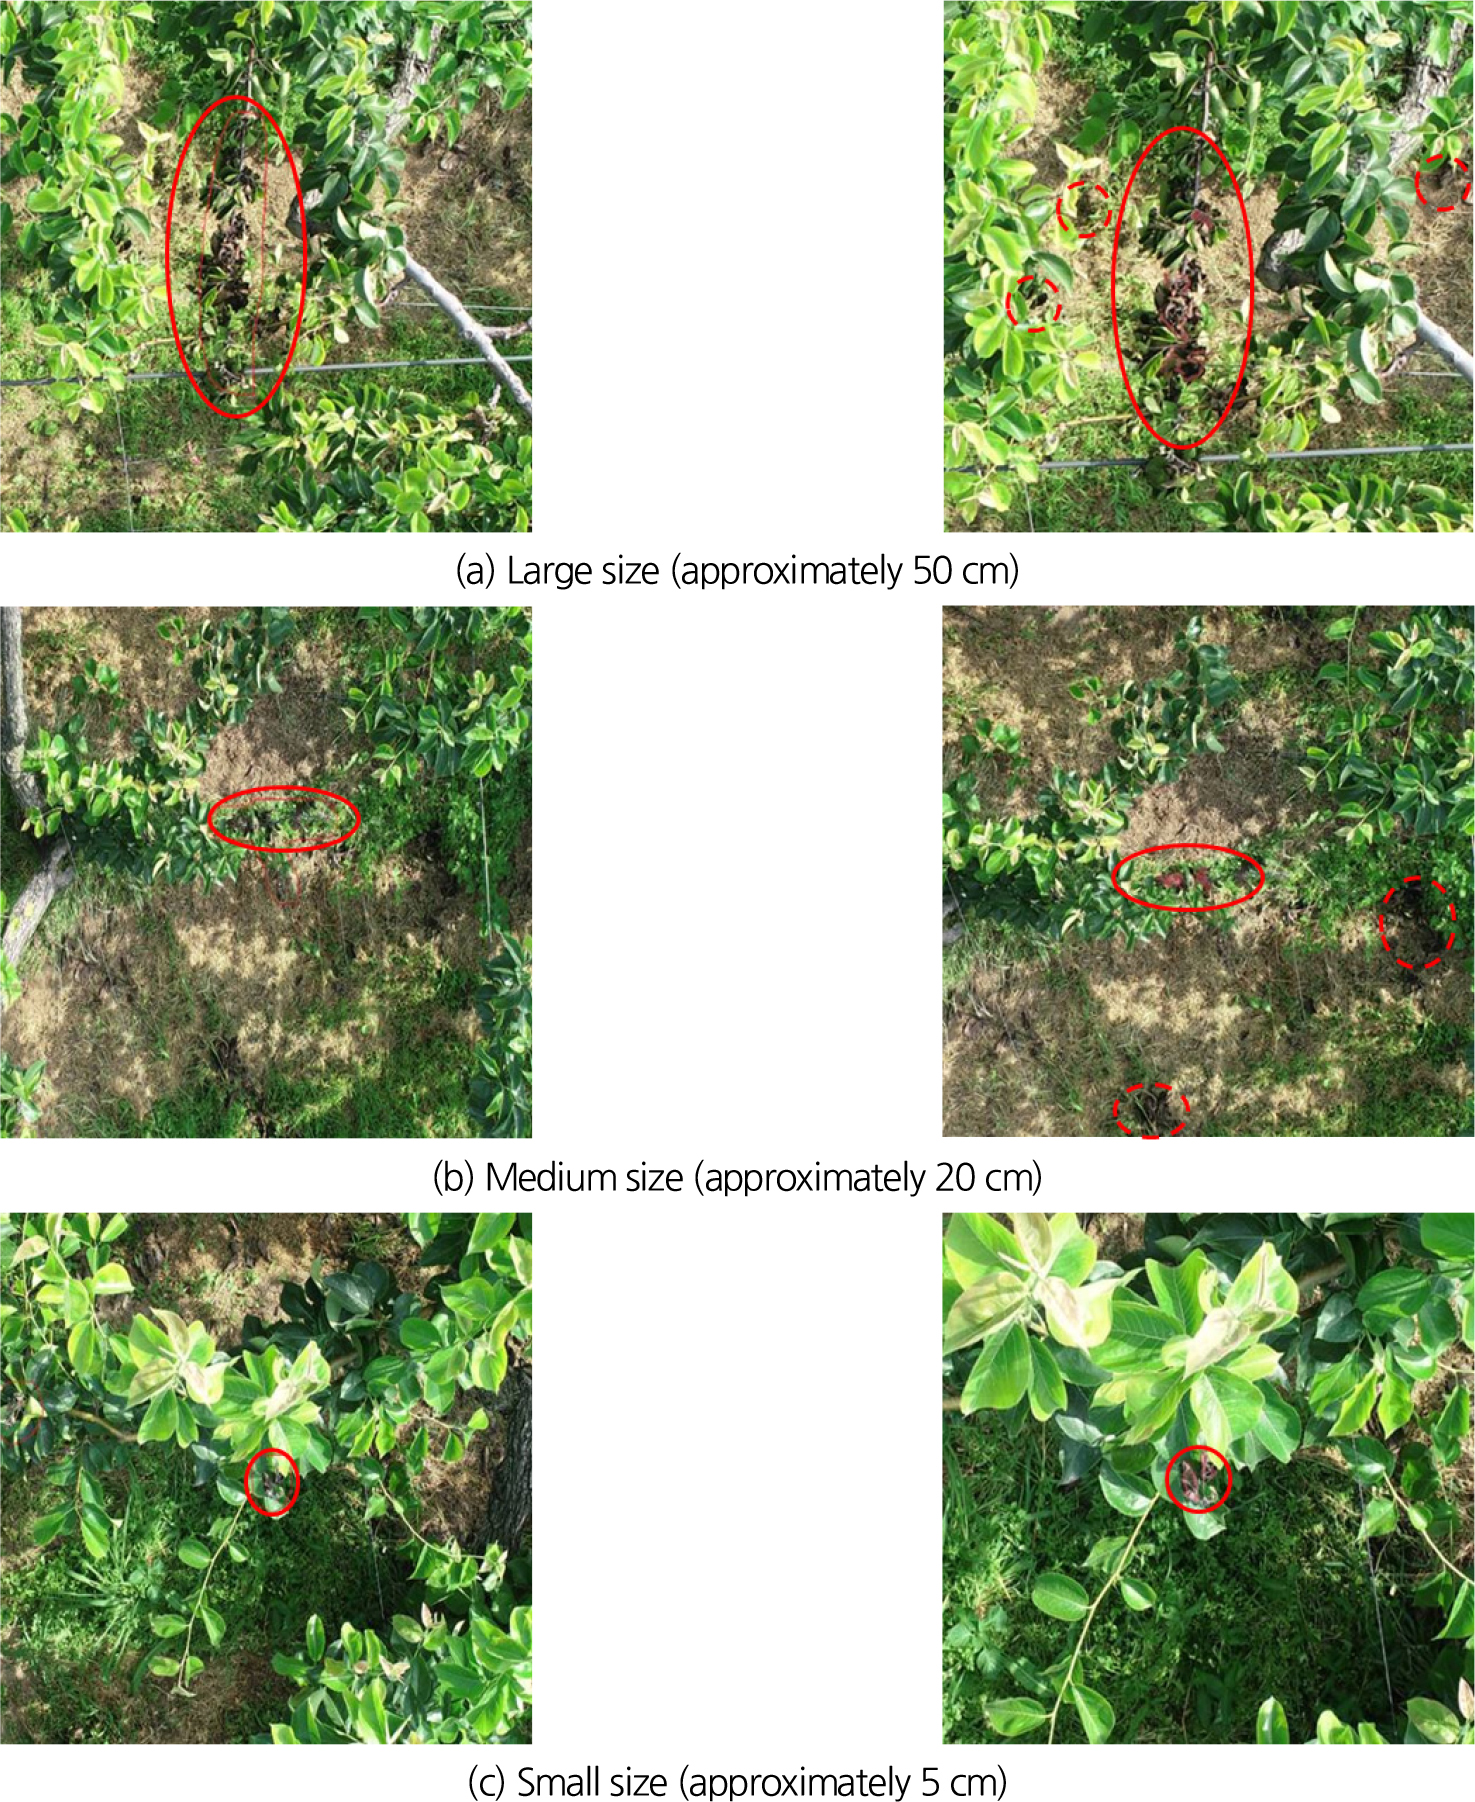
As shown in Fig. 11, areas marked by solid red lines show large-scale, medium-sized, and small-sized incidences of the fire blight, which are about 50 cm in size, 20 cm in size, and 5 cm in size, respectively. In particular, the areas of shading between the ground and tree branches are marked with red dotted lines, and the test sites that have fallen dried branches can be detected accurately without recognizing them as fire blight. However, some of the test sites and very small shaded parts of a normal branch were also mis-detected as shown in Fig. 12. In order to increase the predictive accuracy in the future, more learning will be required using various types of imaging.

Table 5 shows the results of actual detection of fire blight using learning results from RGB images of pear fire blight taken at a height of 6 m.
Table 5.
Results of detection of actual fire blight by the CNN learning method in deep learning
| Confusion matrix | Prediction | Total | Prediction ratio (%) | ||
| Infection | No infection | ||||
| Actual | Infection | 15 | 6 | 21 | 71.4 |
| No infection | 5 | 14 | 19 | 73.7 | |
As shown in Table 5, 40 images were used for the training test, consisting of 21 images of fire blight infection and 19 images of the non-infected fruit tree.
As a result, 15 of the 21 images of an infected fruit tree were recognized as fire blight, while 6 images were recognized as non-infected, resulting in a prediction rate of 71.4%. In addition, the test results of 19 images of the non-infected orchard showed that 14 images were recognized as non-infected, and 5 images were recognized as infected, with a prediction rate of 73.7%.
Therefore, it is possible to detect fire blight if a CNN of Deep Learning is used after obtaining the images using drones in the pear orchard. In particular, if this fire blight detection system can detect partial fire blight in the pear orchard during actual field prediction, the spread of the disease and its damage can be reduced and also the reduction of manpower and time required for wide-area prediction can be achieved.
Conclusions
In this study, a RGB sensor was installed on a rotary-wing drone to obtain RGB images of the fire blight simulation site and the actual infection of fire blight, and to develop a system that can determine the occurrence of fire blight in the field by analyzing the detection status of fire blight by using Deep Learning's CNN. Images of infected areas were acquired with 0.32 cm/pixel images at an altitude of 6 m, with a spatial resolution of 0.11 cm/pixel at an altitude of 12 m. 131 images out of a total of 231 simulation images were used for training and 100 images were used for evaluation of learning results. In addition, 100 images out of a total of 140 images of infection were used for training and 40 were used for evaluation of learning results. The fire blight image learning algorithm used Tensorflow, a library of numerical calculations based on the programming language Python. The similarity of image learning was directly compared with the result of the gold standard image and the automatic detection image, and the error was learned based on an average of 22% to prevent overfitting of the image data.
As a result, 64 of the 80 fire blight-infected fruit tree images were recognized as an infection, while 16 were recognized as non-infected and the prediction rate was 80.0%. In addition, in the test results of 20 non-infected orchards, 19 images were recognized as non-infected, and only 1 image was recognized as infected, showing a 95.0% prediction rate. In the case of an actual fire blight-infected branch, 15 of the 21 images of an infected fruit tree were recognized as infected, while 6 images were recognized as non-infected, with a prediction rate of 71.4%. In addition, the test results of 19 images of the non-infected orchard showed that 14 images were recognized as non-infected, and 5 images were recognized as infected, with a prediction rate of 73.7%.
Therefore, the system for analyzing the occurrence of pear fire blight by applying the images acquired with the drones and CNN of Deep Learning developed in this study is possible with high accuracy. In particular, it is believed that by applying the developed system to the site of preliminary pear fire blight, the actual manpower and time required for the prediction of the area of fire blight can be reduced and the spread of the disease and the need for orchard destruction can be reduced. It is believed that more images of infectious diseases will be needed and learned in order to increase the accuracy of predicting fire blight. It is also necessary to analyze the possibility of detecting a highly damaging apple fire blight using the same system.
