

Introduction
Materials and Methods
Sample Collection
Flower Color Measurement and Analysis
Detection of Anthocyanins by Liquid Chromatography
Statistical Analysis
Results
Results of Tree Peony Cluster Analysis
Analysis of Flower Color Characteristics of Different Color Lines
Correlation Analysis between the Flower Color and L*, a*, and b* Values of Tree Peony
Relationship between Different Total Anthocyanin Content (TA) and L*, a*, and b* Values in Different Color Lines
Correlation Analysis between Flower Colors and Anthocyanins
Discussion
Introduction
Flower color is as an important economic trait in flowering plants and as such is the focus of plant breeders. The objective description of flower color is an important part of flower research and the basis of genetic breeding designed to enhance or change flower color. The color recognition mechanism in humans is complicated because the perception and determination of color is easily affected by many factors such as brightness, intensity, light availability, and the vividness of the color (López Camelo and Gómez, 2004). The determination of flower color by researchers is mainly based on visual inspection and experience, methods that cannot accurately describe the colors of flowers. The definition of color in the International Commission of Illumination Color System (CIELAB or CIE L*a*b* color space system) is consistent with the physiological characteristics of the human eye (López Camelo and Gómez, 2004). In this system, three mutually perpendicular coordinate axes are used to represent a color space. The L* value represents the brightness, and changes in the a* and b* values run from negative to positive, indicating the changes from green to red and blue to yellow, respectively (CIE, 2004). The CIE L*a*b* color space system has been used extensively in the color industry to digitally describe colors in textiles, paints, and plastics. Botanical research using CIE L*a*b* has begun to evaluate and define the colors of flowers, fruits, and vegetables (Rolle and Guidoni, 2007).
Anthocyanins are a major factor in the development of flower color in most plants. The synthesis pathway of anthocyanins in plants has been relatively well clarified. Cyanidin (Cy), pelargonidin (Pg), and delphinidin (Dp) are synthesized along different branches during anthocyanin synthesis (Du et al., 2015). Among them, cyanidin-based anthocyanins are methylated by anthocyanin O-methyltransferase to form peonidin (Pn) (Nakamura et al., 2015). The differences in the types and content of anthocyanins are the main cause of the variation in flower color. For example, in Senecio cruentus, blue and red flowers mainly contain Dp- and Cy-type anthocyanins, pink flowers contain Cy- and Pg-type anthocyanins, and purple flowers contain Dp- and Cy-type anthocyanins (Sun et al., 2009). Among the four color lines of hard water lily, two Dp-type anthocyanins and two Cy-type anthocyanins are the main factors that determine flower color (Zhu et al., 2012a). Research related to Rhododendron (Du et al., 2018), Lycoris longituba (He et al., 2011), tropical water lily (Zhu et al., 2012b), and herbaceous peony (Jia et al., 2008) has confirmed the relationship between anthocyanins and flower color.
Tree peony (Paeonia suffruticosa) includes a group of famous ornamental flowering tree species in China that has been divided into four cultivar groups based on their morphological characteristics and geographical distributions, named the Zhongyuan (Central Plains of China), Xinan (Southwest China), Jiangnan (southern region along the Yangtze River), and Xibei (Northwest China) groups (Li et al., 2011). Tree peony has a rich variety of flower colors. Having an accurate description of flower color is important for research on genetic breeding of flowering plants of different colors using modern genetics technology. In recent years, the CIE L*a*b* color space system has also been applied to the measurement of flower color of Zhongyuan cultivars, Japanese cultivars, and Paeonia rockii (Wang et al., 2001; Wu et al., 2016). Zhang et al. (2006) documented that the composition of anthocyanins in the flower color of tree peony mainly included six kinds, namely, Pn3G, Pn3G5G, Cy3G, Cy3G5G, Pg3G, and Pg3G5G. The differences in the composition of anthocyanins in different cultivars are important factors related to the diversity of the flower color of tree peony. The city of Luoyang in Henan Province, China, is one of the concentrated areas with many different types of trees in the Zhongyuan cultivar group. Tree peony has many cultivars, with diverse colors, making it difficult to classify flower color with unaided visual observation. In addition, the relationship between different types of anthocyanins and flower color has not been clearly defined. This study used the common tree peony cultivars of the Zhongyuan cultivar group in Luoyang and the CIE L*a*b* color space system to classify flower color and to explore the relationship between anthocyanin components and flower color. Our results lay the foundation for plant breeding designed to control flower color precisely.
Materials and Methods
Sample Collection
In this study, flower samples of 150 cultivars of tree peony (Paeonia suffruticosa) were collected in April 2019, including 72 cultivars collected from the Peony Institute of Luoyang (Luoyang, Henan Province, China), 43 from the Luoyang Academy of Agricultural Science (Luoyang), and 35 from the Sui and Tang Dynasty Town Botanical Garden (Luoyang). For each cultivar, three healthy plants (>8 years of age) were selected for sampling. Flower samples with spots at the base of the petals were harvested. Next, the flower samples were frozen in liquid nitrogen and stored in a −80°C freezer.
Flower Color Measurement and Analysis
The 3nh colorimeter (Model No.: SR-60, Shenzhen ThreeNH Technology Co., Ltd., Shenzhen, China) was used to measure and record the L*, a*, and b* values of the tree peony petal samples. Three biological replicates and three technical replicates were used for the measurement of each cultivar and each flower sample, respectively. Systematic cluster analysis was performed using the sum of squares and Ward’s method in SPSS software (Version 24.0, IBM SPSS Inc., Chicago, IL, USA). The colors were defined and classified based on visual observations. An ACM-200 plus anthocyanin content meter (Opti-Sciences Inc., Hudson, NH, USA) was used to determine the TA content with three biological replicates and three technical replicates.
Detection of Anthocyanins by Liquid Chromatography
Qualitative analysis was performed on an Agilent 1290 UPLC system (Agilent Technologies, Waldbronn, Germany) with three biological replicates. First, 5 mL methanolic hydrochloric acid (v/v, 0.01%) was added to 0.5 g of ground petals, followed by shaking, mixing, and then standing at 4°C for 8 hours before centrifugation at 12,000 rpm to collect the supernatant. The anthocyanin solution was obtained after filtering the supernatant through 0.22-µm filter paper. Detection conditions for the liquid chromatography used in this study were as described by Zhao et al. (2014). The chromatographic column was an Eclipse×DB-C18 (Aligent, Palo Alto, CA, USA) with a pore diameter and size of 5 µm and 4.6 × 250 mm, respectively. The mobile phase employed liquids A (formic acid:water = 10:90) and B (methanol acetonitrile:water = 10:40:50). The linear gradient elution was performed as follows: 10–20% solution B from 0 to 30 min, 20–30% solution B from 31 to 50 min, and 30–40% solution B from 51 to 60 min. The injection volume was 5 µL, and the detection wavelength, flow rate, and column temperature were 520 nm, 0.8 mL·min-1, and 30°C, respectively. Six anthocyanin standards including cyanidin-3,5-di-O-glucoside (Cy3G5G), cyanidin-3-O-glucoside (Cy3G5G), peonidin- 3,5-di-O-glucoside (Pn3G5G), peonidin-3-O-glucoside (Pn3G), pelargonidin-3,5-di-O-glucoside (Pg3G5G), and pelargonidin- 3-O-glucoside (Pg3G) were purchased from SolarBio Inc., Ltd. (Beijing, China). The peak areas were used to present the anthocyanin contents.
Statistical Analysis
In this study, Excel 2007 software (Microsoft Corp., Redmond, WA, USA) was used to analyze the relationship between L*, a*, and b* values of different color lines and the relationship between TA and L*, a*, and b* values of different color lines. In addition, SPSS24.0 software (IBM SPSS Inc., Chicago, IL, USA) was used for statistical analysis. The multiple stepwise regression was used to analyze the correlation between L*, a*, and b* values and six anthocyanins.
Results
Results of Tree Peony Cluster Analysis
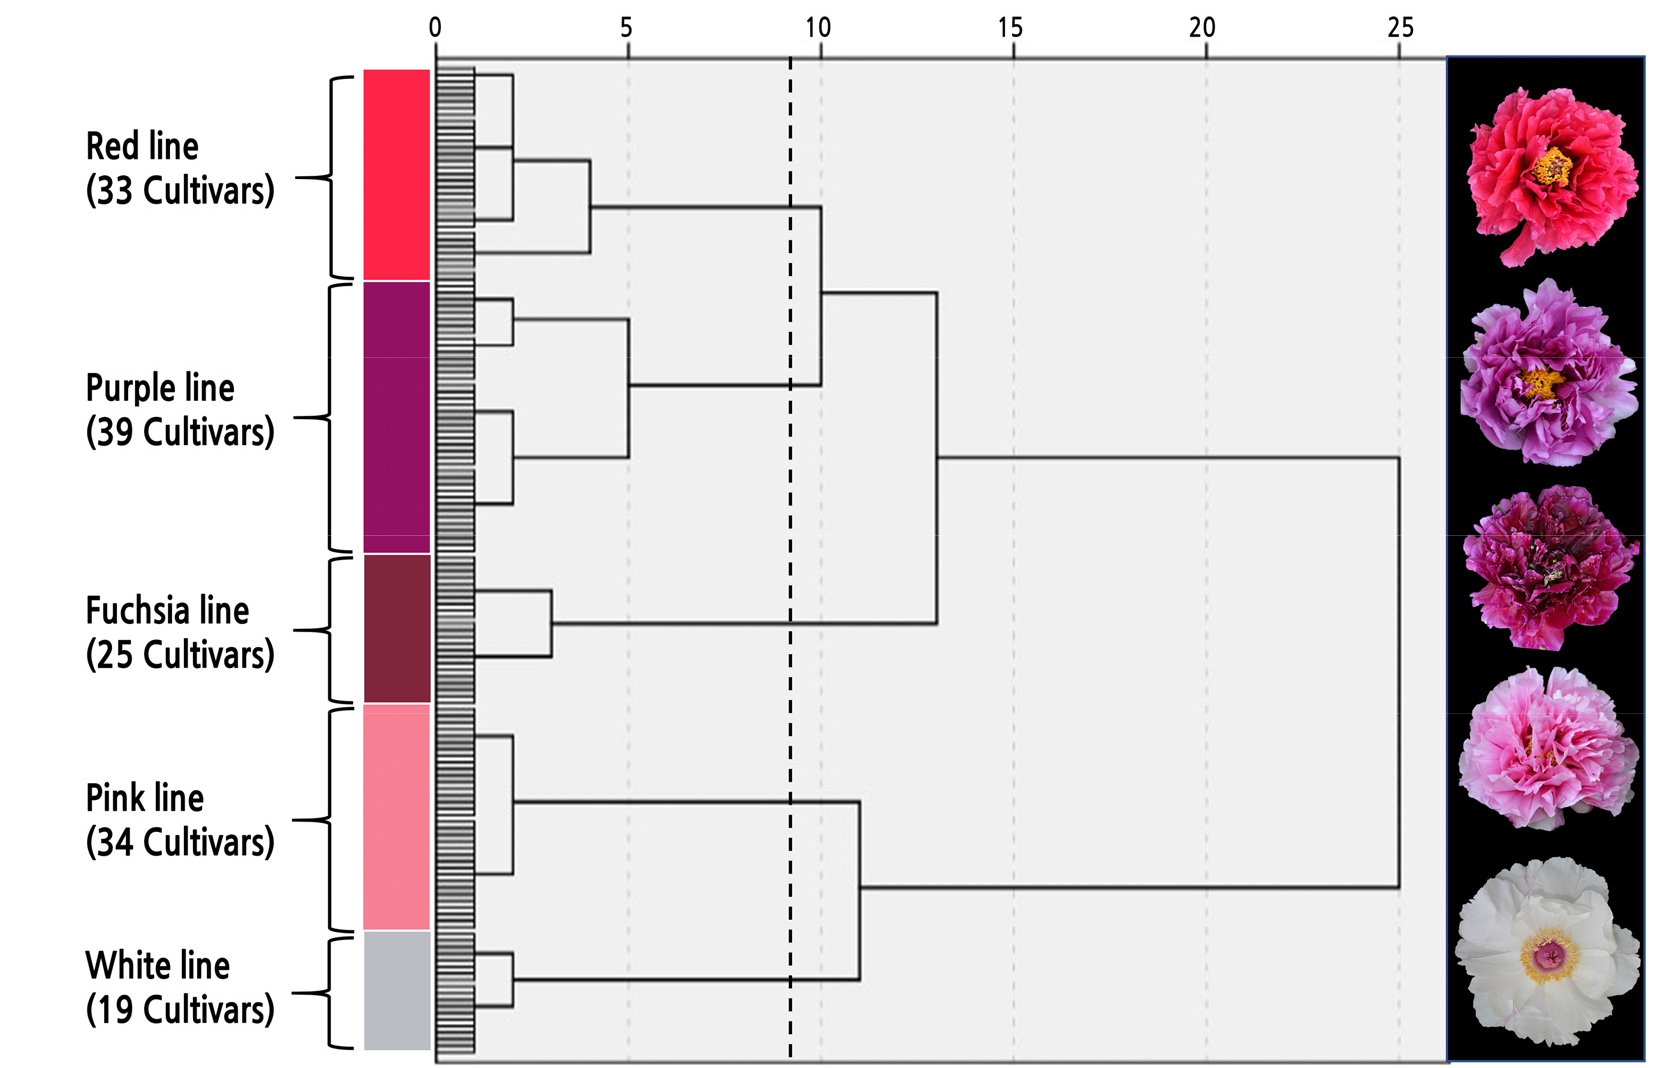
After measuring the color of 150 tree peony cultivars, the L*, a* and b* values were found to fall between 19.07 and 96.40, ‑ 5.45 and 76.34, and ‑ 30.08 and 27.56, respectively (Suppl. Table 1s). Systematic cluster analysis was performed on different colors of tree peony cultivars according to the L*, a*, and b* values. These data were combined with visual observations, and the flower colors were divided into five phenotypes: pink, white, red, purple, and fuchsia lines (Fig. 1).
Analysis of Flower Color Characteristics of Different Color Lines
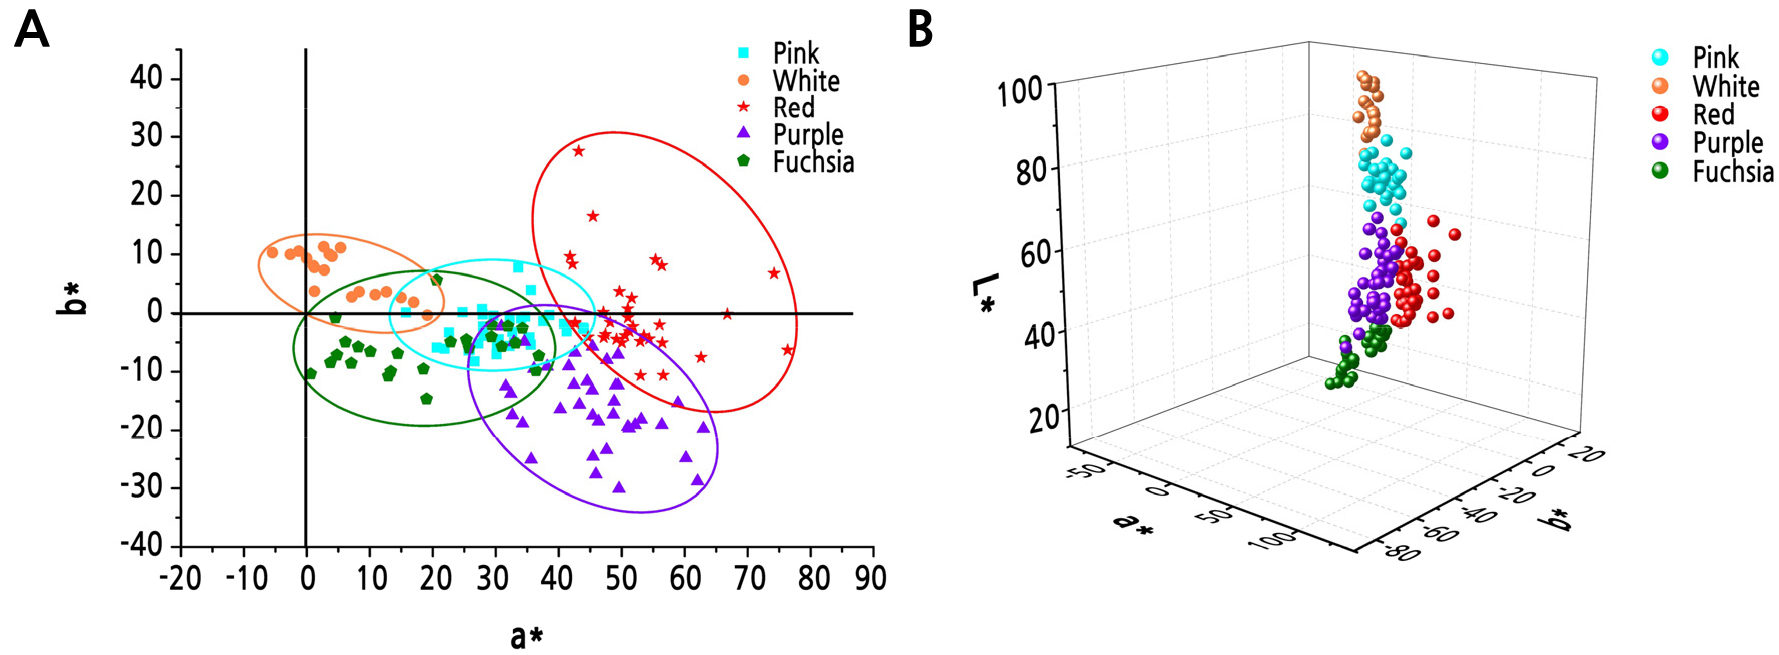
Based on the analysis of color parameters in the five lines, the L* values were ranked from high to low as white > pink > purple > red > fuchsia; a* values were ranked as red > purple > pink > fuchsia > white; and b* values were ranked as white > red > pink > fuchsia > purple (Suppl. Fig. 1s). In the a* and b* coordinate systems, pink, purple, and fuchsia line cultivars were mainly distributed in the fourth quadrant, white line cultivars were mainly distributed in the first quadrant, and red line cultivars were mainly distributed in the first and fourth quadrants (Fig. 2A). A few white line cultivars were distributed in the second quadrant, and a few pink and fuchsia line cultivars were distributed in the first quadrant. The three-dimensional coordinate graphs of L*, a*, and b* showed that different color line cultivars had relatively independent spatial characteristics in the three-dimensional space (Fig. 2B).
Correlation Analysis between the Flower Color and L*, a*, and b* Values of Tree Peony
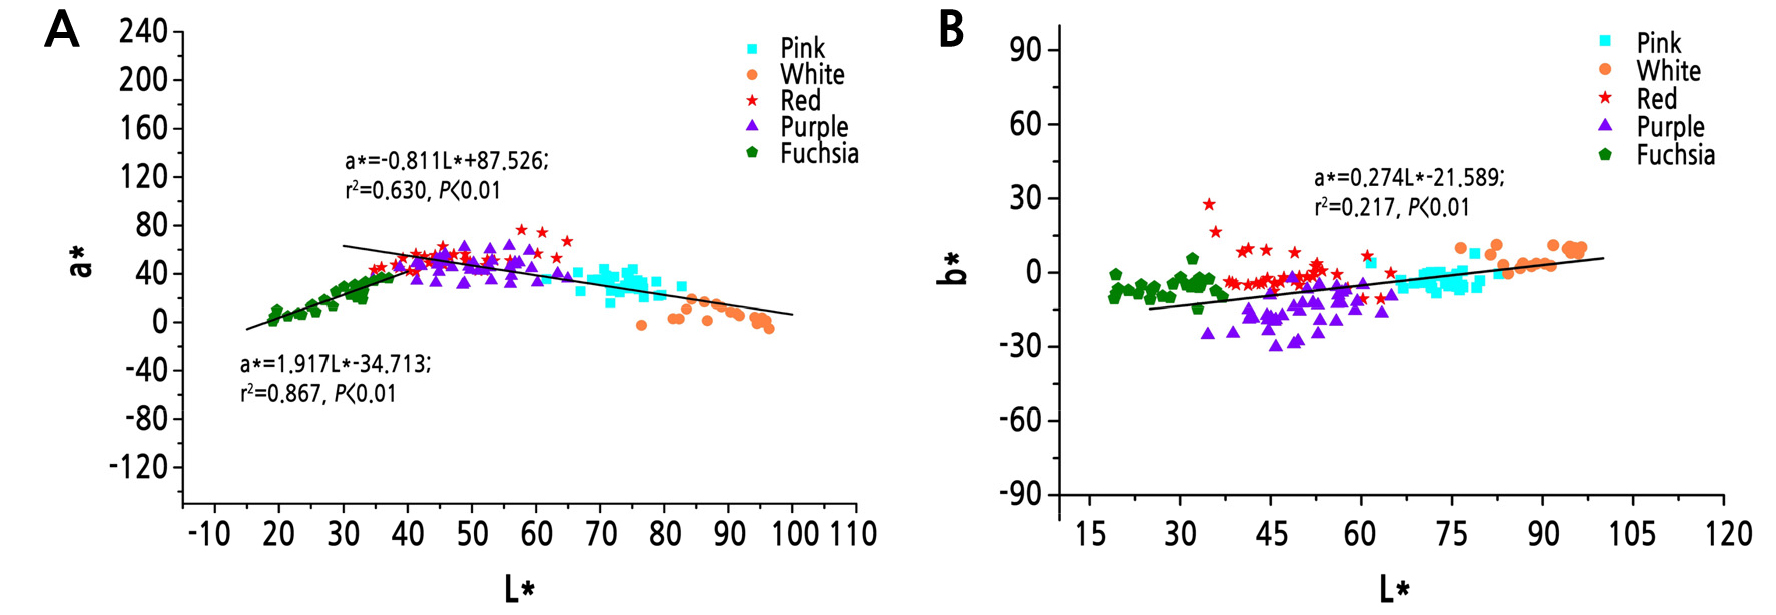
Analysis of the correlation between the color parameters of different flower color lines of tree peony showed that L* had significant correlations with a* (p < 0.01). As shown in Fig. 3A, L* had a significant positive correlation with a* in the fuchsia line and had significant negative correlations with a* in the white, pink, red, and purple lines. As shown in Fig. 3B, except for the purple line, b* had positive correlations with L* in the remaining color lines of tree peony (p < 0.01).
Relationship between Different Total Anthocyanin Content (TA) and L*, a*, and b* Values in Different Color Lines
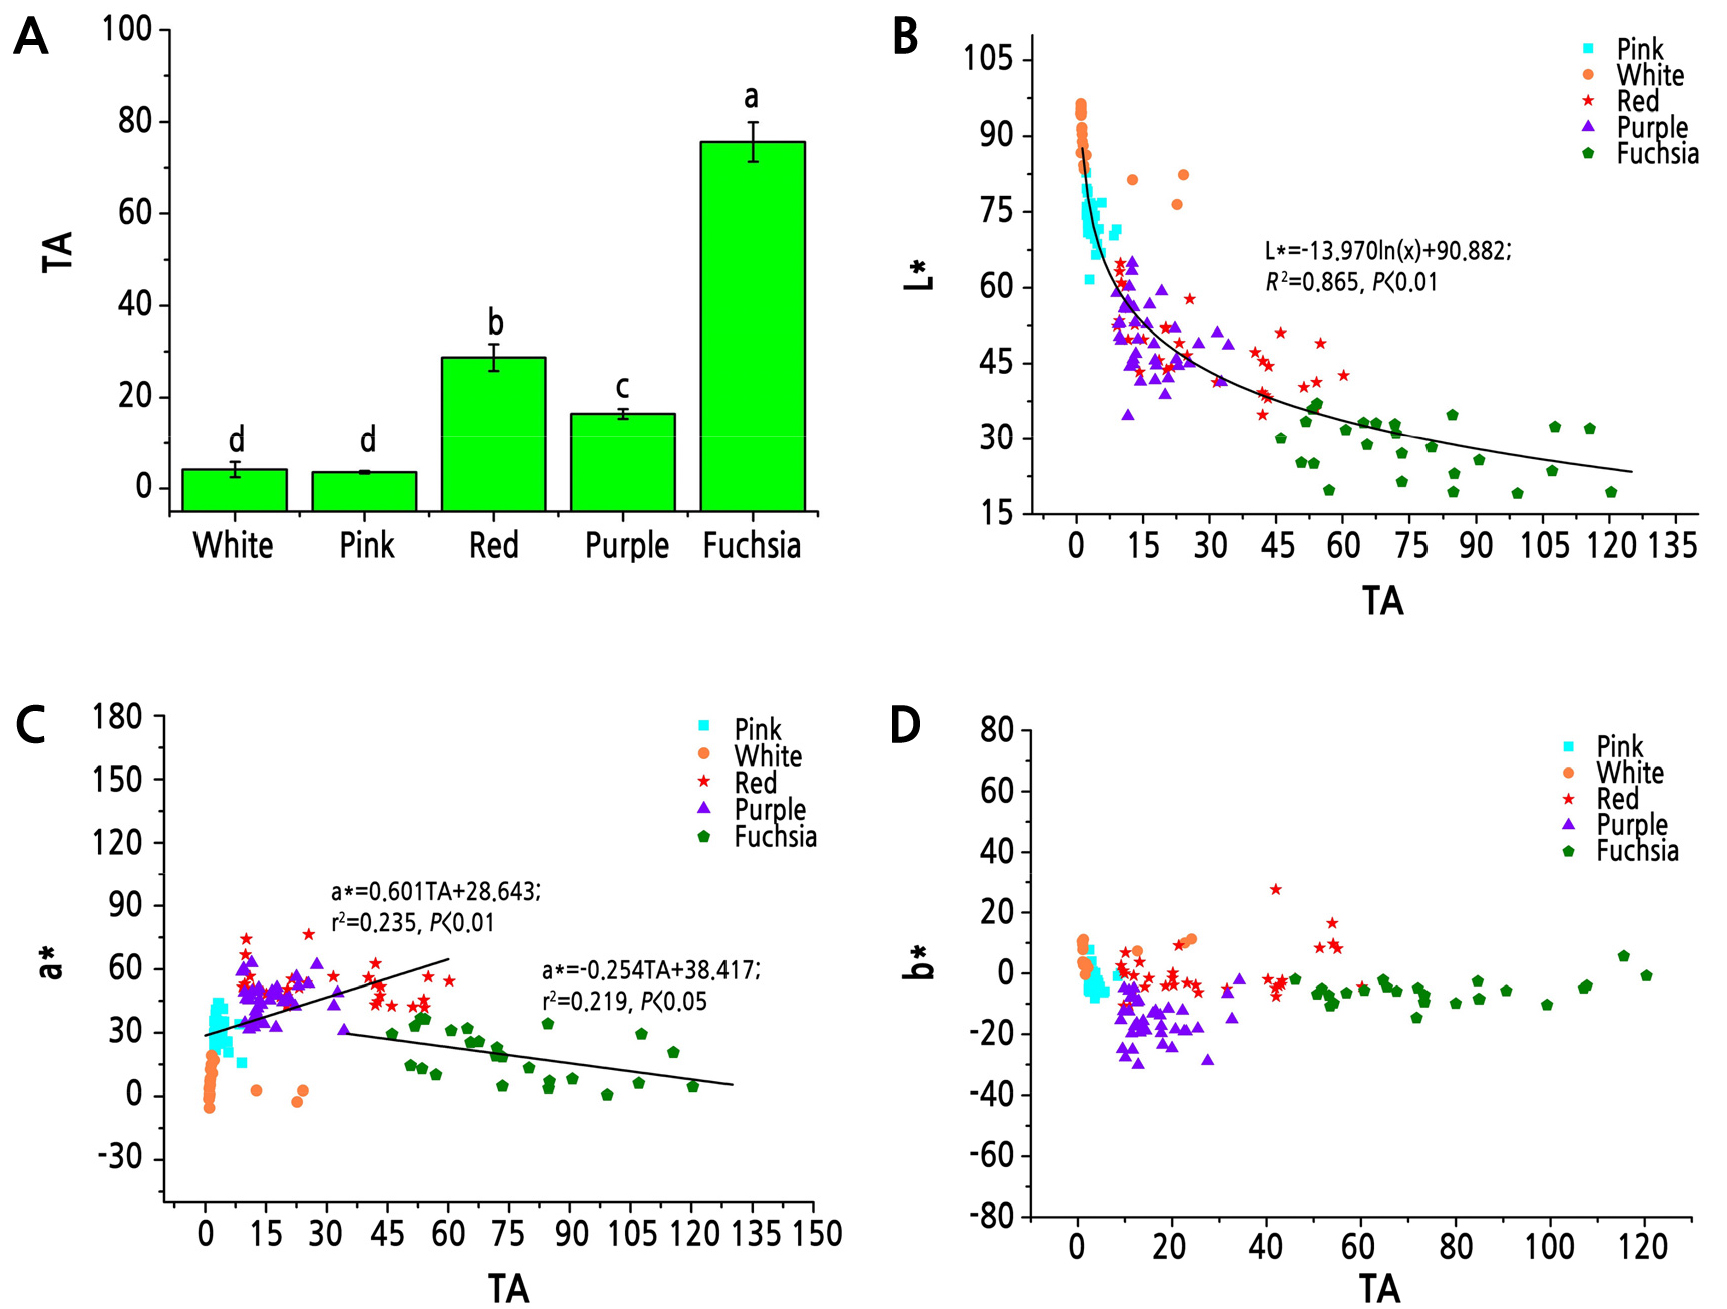
The TA contents of tree peony petals in different color lines were analyzed and showed that the fuchsia line had the highest relative content of anthocyanins, followed by the red and purple lines, while the pink and white lines had the lowest TA contents (Fig. 4A). Correlation analysis between TA and L*, a*, and b* values in different color lines was performed and showed that L* had a significant negative correlation with TA (p < 0.01). The L* values decreased gradually and slowly with an increase of anthocyanin content (Fig. 4B). The a* values were significantly negatively correlated (p < 0.05) with TA content in the fuchsia line and positively correlated (p < 0.01) with TA content in the remaining color lines of tree peony (Fig. 4C). The b* values had no correlations with the TA contents in the tree peony (Fig. 4D).
Correlation Analysis between Flower Colors and Anthocyanins
Values from the white line were removed for further analysis. To explore the relationship between tree peony pigment composition and the flower color, the L*, a*, and b* values were used as dependent variables, and the contents of six anthocyanins were used as independent variables. This was followed by stepwise regression to establish the regression equations between the flower color and the anthocyanins as well as to deduce the quantitative relationships between the two. The results of statistical analysis were as follows:
The p values indicated that a significant correlation exists between flower color and the anthocyanin components of tree peony. Equation (1) showed a negative correlation between L*, which represented color brightness, and the four anthocyanins; a higher content of the four anthocyanins resulted in less brightness of the flower color. Equation (2) showed that a positive correlation exists between a* and the Cy3G5G, Pg3G5G, and Pn3G5G anthocyanins in the pink, red, and purple color lines; higher contents of these three anthocyanins resulted in more redness of the flower color. Equation (3) showed that a positive correlation exists between a* and the Pg3G5G anthocyanins in the fuchsia line, and a negative correlation exists between a* and the Pn3G anthocyanins in this color line. Equation (4) showed that a positive correlation exists between b* and the Pg3G5G, Pn3G, and Cy3G5G anthocyanins in the pink, red, and purple lines; higher contents of these three anthocyanins resulted in a more yellow flower color.
Discussion
The CIE L*a*b* color space system is often used to describe flower color. This study performed cluster analysis using L*, a*, and b* values of the flower colors to divide 150 Zhongyuan tree peony cultivars into five major color lines. The L*, a*, and b* values of each color line presented unique spatial characteristics in the three-dimensional coordinates, which indicated that the CIE L*a*b* color space system accurately described the flower color of tree peony allowing an objective distinction between different color lines. Wu et al. (2016) divided the colors of 466 P. rockii plants into five major color lines: white, pink, blue, fuchsia, and black. Zhang (2013) divided 43 cultivars of the Jiangnan group into white, pink, light-blue, and fuchsia lines. The detailed description of the colors of P. rockii and Jiangnan cultivars showed that color line classification based on L*, a*, and b* values had similar results for the Zhongyuan group, P. rockii, and the Jiangnan group. The color line classification of the Zhongyuan group had no blue color line. The cultivar that is generally considered blue, ‘Lanbaoshi’, was classified in the pink line. The blue color line in P. rockii mainly has purplish pink and blue-pink colors. Therefore, we believe that there is no true blue-colored cultivar in tree peony, and the color of the tree peony that is commonly regarded as blue is actually closer to pink.
In addition to the five major color lines in the present study, the tree peonies planted in the Luoyang region also include a small number of trees in the yellow, green, and multicolor lines, but they are all very rare. The main yellow cultivar of tree peony is ‘Haihuang’, a cultivar imported from the USA, and the main green and multicolor cultivars are ‘Doulu’ and ‘ErQiao’, respectively. In addition, some studies have shown that yellow and green tree peonies were not independently grouped during cluster analysis (Hong et al., 2012; Wu et al., 2016). Therefore, the present study did not include the above three color cultivars in the scope of analysis but only summarized the main Zhongyuan cultivars as belonging to five major color lines. Each of the major color lines had many cultivars, which were conductive to the genetic analysis of flower colors of tree peony. Given the rareness of the yellow, green, and multicolor lines, the breeding of these flower color cultivars will be an important research direction for the future.
Anthocyanins are the main source of flower color development in most plants. Wang et al. (2001) has shown that L* had a significant negative correlation with TA in tree peony, indicating that flower brightness declined as the anthocyanin content increased. Through the analysis of additional cultivars, the present study showed that the L* values declined logarithmically with an increase in TA content, and the L* values of the fuchsia line were significantly and slowly reduced with an increase in TA content. The effect of TA on the a* values in flower color was relatively significant; that is, the a* values increased with an increase of TA content in tree peony except in the fuchsia line. However, Wang et al. (2001) showed that some of the Zhongyuan group and Daikon tree peony cultivars turned red when the TA content declined. In the present study, TA was negatively correlated with the a* values of the fuchsia line, suggesting that when anthocyanins accumulated to a certain degree, they had a negative impact on redness. Moreover, we found that the TA content varied little in some cultivars of tree peony. However, based on liquid chromatography analysis, different color parameters, such as in the red cultivar ‘Dashenle’ and the purple cultivar ‘Qielandansha’, were significantly different in terms of anthocyanin content. The ‘Dashenle’ cultivar had the highest Pg-type anthocyanin content, which was followed by the Pn-type anthocyanin content, and had no Cy-type anthocyanins. Meanwhile, the ‘Qielandansha’ cultivar had the highest Pn-type anthocyanin content, which was followed by Cy-type anthocyanin content, and had no Pg-type anthocyanins. These results indicated that different types of anthocyanins had important effects on flower color in cultivars having the same TA content.
Six anthocyanins including Cy3G, Cy3G5G, Pn3G, Pn3G5G, Pg3G, and Pg3G5G were detected by liquid chromatography in various tree peony cultivars, which was consistent with previous studies of anthocyanins in tree peony (Wang et al., 2001; Zhang et al., 2006). In the four color lines, Pg3G5G had a positive linear correlation with a*. Zhang (2013) documented a similar relationship among Cy3G5G, Pg3G5G, and a* in the Jiangnan cultivar group of tree peony. We suggest that increasing Pg3G5G contents during breeding will increase the redness of the tree peony flower. In the fuchsia line, Pn3G was negatively correlated with a*; that is, an excessive accumulation of Pn3G was the main factor decreasing redness.
In recent years, researchers have gained a better understanding of the synthetic pathway of anthocyanin production. For example, F3’H, F3H, and F3’5’H divide the synthetic pathway of anthocyanins into three branches and eventually synthesize Cy, Pg, and Dp-type anthocyanins, respectively. Among them, the Cy type was modified by anthocyanin O-methyltransferases to synthesize Pn-type anthocyanins (Yoshimura et al., 2012). Dp-type anthocyanins are the main component of blue flowers, and F3’5’H is the key gene for the synthesis of Dp anthocyanin branch. Overexpression of an exogenous F3’5’H gene in roses results in blue-flowered plants (Katsumoto et al., 2007). The main reason for the absence of blue in the Zhongyuan cultivar group was caused by the lack of Dp-type anthocyanin. Therefore, research on the F3’5’H gene in tree peony may be the key to the future breeding of blue cultivars. In the downstream synthetic pathway of anthocyanins, dihydroflavonol 4-reductase (DFR) proteins mainly catalyze the reduction of substrates such as dihydrokaempferol and dihydroquercetin and eventually synthesize Pg- and Cy-type anthocyanins. Studies have shown that the DFR protein sequence has a substrate-specific region (Katsu et al., 2017), and changes in the sequence of this region lead to the substrate preference of DFR (Shimada et al., 2005). Research related to the DFR gene in tree peony may be beneficial to regulating the synthesis of Pg-type anthocyanins and increasing the redness of some cultivars. Study of the above genes may help us control the synthesis of anthocyanin types and ultimately help researchers achieve the precise regulation of the flower color of tree peonies.
Supplementary Material
Supplementary materials are available at Horticultural Science and Technology website (https://www.hst-j.org).
- HORT_20200070_Table_1s.pdf
Petal doration and pigment constitution in tree peony flowers of 150 cultivars
- HORT_20200070_Fig_1s.pdf
Box plot of different color lines of tree peonies according to L*,a*,and b*.
