

Introduction
Materials and Methods
Plant Materials and Growth Conditions
Light Source
Experimental Sampling for Characterization
Soluble Sugar Content
Soluble Protein Content
Superoxide Dismutase Activity
Peroxidase Activity
Catalase Activity
Malondialdehyde Contents
Chlorophyll and Carotenoid Contents
Photosynthetic Characteristics and Chlorophyll Fluorescence
Stomata Characteristics
Statistical Analysis
Results
Discussion
Introduction
Light is one of the most important environmental variables affecting plant growth and morphology (Hernández et al., 2016). The use of artificial lighting has become increasingly relevant in agriculture, not only because of the associated increased productivity and quality, but also because it allows cultivation of crops in areas with insufficient natural light (e.g. indoor cultivation). One type of artificial lighting, light-emitting diodes (LEDs), has been widely used in scientific research and culture, since an LED source can be set to a narrow and specific spectral composition, has a long operating life, is durable and small, and and remains relatively cool (Bantis et al., 2016). Numerous studies investigating the effects of LEDs on plants have produced promising results. LEDs set to specific wavelengths have been used to regulate various morphological and physiological attributes as well as photosynthetic abilities of of plantlets grown in vitro, including shoot elongation, antioxidant enzyme activities, rhizogenesis, leaf anatomy, chlorophyll content, and chlorophyll fluorescence (Wang et al., 2009; Simlat et al., 2016). Blue light alone resultss in decreased net photosynthetic rate (Pn) in many plants, such as Chrysanthemum morifolium (Kim et al., 2004) and Withania somnifera (L.) (Lee et al., 2007). Compared to monochromatic light, a mixture of red (R) and blue (B) may increase the Pn and the shoot dry weight (Hogewoning et al., 2010b). A combination of red and blue LEDs has been used for the production of many plant species in controlled environments, including potato and Brazilian ginseng (Luz et al., 2015); lettuce (Cao et al., 2013 ); spinach, radish, and lettuce (Yorio et al., 2001); and Brassica chinensis (Ani et al., 2015). In controlled lighting regimes, the optimal ratio between the red and blue LEDs must be determined, as this ratio affects plant growth (Kalyani et al., 2012). Earlier studies revealed that the maximum fresh and dry weights of in vitro-grown strawberry plantlets, in vitro-grown rapeseed (Brassica napus L.), and cucumber seedlings were reached when the R:B ratio was 7:3 (Cao et al., 2013), 1:3 (Li et al., 2013), or 9:1 (Hernández and Kubota, 2016), respectively.
Photosynthetic pigments mainly absorb light in the red and blue spectrum (Yao et al., 2017). Other scientists reported that among LEDs, red and blue light exerted the greatest effects on the photosynthetic rate and plant growth (Wang et al., 2011; Simlat et al., 2016). Red light may influence stem elongation, chlorophyll content, soluble sugar content, and the photosynthetic apparatus (Akcin et al., 2016), while also initiating root development (Daud et al., 2013). Blue light prompts phototropins to induce physiological responses that regulate leaf expansion, stomata opening, leaf anatomy, enzyme synthesis, chloroplast movements (Hogewoning et al., 2010; Akcin et al., 2016), and carotenoid and soluble sugar contents (Lee et al., 2007). However, plants under red LED light alone exhibit abnormal leaf morphology as well as a lower photosynthetic rate than plants exposed to white light or red supplemented with blue light (Liu et al., 2018). Hogewoning et al. (2010b) reported that the dysfunctional leaf photosynthetic machinery induced by red light alone can be recovered by exposure to as little as 7% blue light.
Gerbera jamesonii is an important plant species of the global cut-flower industry because of its great diversity of flower colors and high cut-flower yield. Research on G. jamesonii has mainly focused on micropropagation and proliferation (Minerva et al., 2013; Singh et al., 2016), with relatively few studies examining the effects of different artificial light sources. Wang et al. (2011) studied the effects of different cold cathode fluorescent lighting conditions on G. jamesonii plantlets, while Gabryszewska and Rudnicki (1995) researched the growth and development of G. jamesonii under different artificial light qualities. However, the effect of LEDs on G. jamesonii growth and physiology has not been reported.
The objective of this paper was to characterize how different ratios of red and blue light produced by LEDs influence the growth and physiology of G. jamesonii. The morphological indices, physiological parameters, and photosynthetic performance of the plantlets were analyzed. The data presented here will serve as basis for designing LED sources suitable for industrialized seedling production of G. jamesonii in a controlled environment.
Materials and Methods
Plant Materials and Growth Conditions
In vitro-grown plantlets of G. jamesonii cultivar ‘De Kou’ (Dezhou Shijifeng Horticulture Scientific and Innovation Co., LTD, China) were grown in culture bottles (a transparent glass bottle with a capacity of 250 mL; four plants per bottle) containing 40 mL half-strength Murashige and Skoog medium (Murashige and Skoog, 1962) supplemented with 0.5 mg·L-1 3-indolebutyric acid (IBA; Beijing Solarbio, Beijing, China), 0.5 mg·L-1 1-indoleacetic acid (IAA; Sigma-Aldrich, St Louis, USA), 30 g·L-1 sucrose (Shanghai Just Scientific, Shanghai, China), and 7 g·L-1 agar powder (Sigma-Aldrich). The pH of the medium was adjusted to pH 5.8 with 1 M NaOH prior to autoclaving at 121°C for 15 min.
Plantlets were placed into the bottles and and put in the growth room with 40 µmol·m-2·s-1 irradiance provided by fluorescent lamps (TL-D 36W, Philips, China). After the third leaf fully expanded, uniform plantlets were randomly divided into seven groups, each group comprising 15 bottles, three plantlets per bottle. One group was cultured under fluorescent lamps as the control (CK), while the remaining six groups were exposed to different LED conditions in a controlled environment (R, R:B = 8:2, R:B = 7:3, R:B = 6:4, R:B = 5:5, and B). Plants were grown at 23 ± 2°C with a relative humidity of 75 ± 5%.
Light Source
The LEDs were equipped with light plates (Dongguan Bio-lighting Sciences and Technology Co. Ltd, China) and a DC power supply (PKU-MS605D, Beijing, China). The red and blue irradiances were individually controlled by adjusting the DC supply for each treatment. The LEDs provided red light with a peak wavelength of 657 nm and blue light with a peak wavelength of 450 nm. The light intensity was 40 µmol·m-2·s-1. Six light quality treatments of different R:B ratios were R, R:B = 8:2, R:B = 7:3, R:B = 6:4, R:B = 5:5, and B. Plantlets were cultured in vitro for 30 days prior to sampling.
Experimental Sampling for Characterization
Randomly selected G. jamesonii plantlets were characterized morphologically by assessing their plant height, number of leaves, leaf length and width, number of roots, as well as root length and dry weight. Each measurement was completed using seven replicates, with three plantlets per replicate. The third leaf from the top was used as the test material for assessing physiological indicators (i.e. soluble sugar and protein contents and antioxidant enzyme activities), and and each measurement was completed using three replicates, with three plantlets per replicate. Additionally, photosynthetic indices (i.e. chlorophyll and carotenoid contents, photosynthetic parameters and characteristics, and chlorophyll fluorescence) were measured from the third leaf, using three different replicates than above, respectively, with three plantlets per replicate. All materials were randomly selected, uniform plantlets in each replicate.
Soluble Sugar Content
The soluble sugar content was measured according to the method described by Zhao et al. (1998). Specifically, 0.2 g leaf material (fresh weight [FW]) was placed in a test tube, to which 5 mL distilled water was added. The test tubes were sealed with plastic film and then placed in boiling water for 30 min. The supernatant was filtered, and the filtrate was collected in a 25-mL bottle. A 0.5-mL aliquot was added to a test tube and then 1.5 mL distilled water, phenol, and concentrated sulfuric acid were added in this order. The phenol and sulfuric acid were used to determine the soluble sugar content (at a wavelength of 620 nm) as follows:
soluble sugar (%) = (C × VT/a × n)/(W ×106),
where C is the soluble sugar content standard (g) according to a standard equation, VT is the extract volume (mL), a isis the sample volume, n is the dilution factor, and W is FW (g).
Soluble Protein Content
Soluble protein content was measured following the method of method of Zhao et al. (1998). Samples (0.2 g FW) were ground in a mortar with liquid nitrogen and then resuspended in 3 mL phosphate-buffered salinesaline (pH 7.0). After a centrifugation step (12,000 × g for 15 min at 4°C), 0.1 mL supernatant was combined with 4.9 mL Coomassie Brilliant Blue G-250 solution (0.1 g·L-1). After 2 min, the soluble protein content was determined (at a wavelength of 595 nm as follows:) as follows:
soluble protein (mg·g) = (C × VT)/(W × Vs × 1,000),
where C is the protein content according to a standard equation (g), VT is the extract volume (mL), Vs is the liquid volume (mL), and W is the sample FW (g).
Superoxide Dismutase Activity
Superoxide dismutase (SOD; EC 1.15.1.1) activity was assayed based on the photochemical method described by Zhao et al. (1998). The assay mixture, which comprised three reagents (xanthine, xanthine oxidase, and cytochrome c) dissolved in potassium buffer, was used at room temperature but was otherwise stored at 4°C. Xanthine (0.5 mM) was prepared fresh and used at room temperature. SOD anions generated by a xanthine/xanthine oxidase system were detected with a chromatin solution. Xanthine oxidase (5 µL of Sigma X4500 diluted with 495 µL potassium phosphate buffer for a final concentration of 0.32 U·mL-1) was prepared fresh and stored on ice when used. Cytochrome c was prepared in phosphate buffer (12.5 mg in 0.5 mL) and maintained on ice when used but was otherwise stored at -20°C. The assay mixture was prepared by mixing 8.85 mL potassium phosphate buffer and 1 mL xanthine. The SOD solution was prepared fresh by diluting 10 µL SOD from bovine liver (Sigma-Aldrich) with 90 µL buffer (960 final concentrations). The final solution was stored on ice when used. The assay mixture (10 mL, which was sufficient for at least 32 wells) was prepared just before use. Sample aliquots (50 µL) were added to the wells of a 96-well plate (Fisher Scientific, Loughborough, UK). Control wells contained SOD solution or buffer instead of the sample. The xanthine oxidase solution (100 µL) was added to the assay mix just before being added to the wells, taking readings once a minute. The assay mixture (250 µL) was pipetted into each well and mixed carefully. The plate was immediately transferred to the VersaMax™ plate reader (Molecular Devices, Sunnyvale, CA, USA), and the increase in absorbance was monitored at 550 nm for at least 5 min using a kinetic program. All data are herein expressed as unit mL-1and were determined as follows: and were determined as follows:
SOD (µmol·g-1) = [(Ack–AE) × V]/[Ack × 1/2 × W × a],
where Ack is the extinction value for the light, AE is the extinction value of the sample tubes, V refers to the total sample volume, a corresponds to the sample consumed during the analysis, and W is the sample FW (g).
Peroxidase Activity
Peroxidase (POD; EC 1.11.1.7) activity was measured by determining the rate of oxidation according to Zhao et al. (1998). The reaction mixture consisted of buffered pyrogallol in 0.1 M potassium phosphate buffer (pH 7.0), 1% H2O2, and the enzyme extract. The reaction rate was calculated by monitoring the changes in absorbance at 430 nm (ε = 12 mM-1 cm-1), with the activity expressed as U·mgprotein-1·min-1:
POD (µmol·g-1) = (Δ470 × VT)/(0.01 × t × Vs × W),
where Δ470 is the change in the absorbance value during the reaction, VT represents the total volume of the enzyme extract (mL), t refers to the reaction time (s), Vs is the volume of the enzyme solution (mL), and W is the sample FW (g).
Catalase Activity
Catalase (CAT; EC 1.11.1.6) activity was assayed according to the method described by Zhao et al. (1998). Aliquots (50 µL) of the leaf extract were added to each well of a 96-well plate (Fisher Scientific), to which 25 µL of 40 µM H2O2 was added. The plates were incubated at 37°C for 30 min prior to the addition of 50 µL reaction buffer containing 100 µM Amplex Red reagent and 0.4 U·mL-1 horseradish peroxidase (Sigma-Aldrich, Poole, UK) to each well. The resulting fluorescence was quantified using a microplate reader (PerSeptive Biosystems, Framingham, USA), with excitation and emission wavelengths of 540 and 590 nm, respectively. The 10 mM Amplex Red stock solution was prepared in DMSO, and aliquots were stored at -20°C. CAT activity was calculated using a standard curve prepared with purified catalase (0 - 2,000 U·mL-1; Sigma-Aldrich):
CAT (µmol·g-1) = (Δ240 × Vt)/(0.01 × t × W × Vs),
where Δ240 is the change in the absorbance value during the reaction, Vt is the total volume of the enzyme extract (mL), t is to the reaction time (s), Vs is the volume of the enzyme solution (mL), and W is the sample FW (g).
Malondialdehyde Contents
Malondialdehyde (MDA) content was determined according to the method of Zhang et al. (2013). Samples (1.0 g FW) were added tosilica sand and then ground in 2 mL 0.1% trichloroacetic acid (TCA). An additional 8 LmL TCA was added before continuing the grinding. Samples were then centrifuged at 4,000 × g for 10 min. The resulting supernatant (2 mL) was added to 2 mL thiobarbituric acid prepared in 0.6% TCA. The reaction mixture was incubated at 100°C for 15 min, after which the reaction was stopped by placing the samples in an ice bath. The control consisted of 2 mL water instead of the extract. The absorbance of the supernatant was measured at 532 and 450 nm as follows: as follows:
MDA (µmol·g-1) = 6.45 × 10 -6 × A532–0.56 × 10 -6 × A450,
where A532 is the absorbance value at 532 nm and A450 is the absorbance value at 450 nm.
Chlorophyll and Carotenoid Contents
Leaf samples were collected from similar positions on 10 plants per treatment. The leaf FWs were 0.1 to 0.2 g. All leaf samples were treated with 10 mL 80% acetone until they turned white. The optical density of the solution was measured with the UV-1800 spectrophotometer (Shimadzu, Japan) at 663 nm (OD663) and 645 nm (OD645) for chlorophyll a (Chl a) and chlorophyll b (Chl b), respectively, and at 470 nm (OD470) for carotenoids. The Chl a and Chl b concentrations were determined as described by Zhao et al. (1998):
Chl a (mg·g-1) = [(12.72 × OD663–2.59 × OD645) × v]/(1,000 × W),
Chl b (mg·g-1) = [(22.88 × OD645–4.67 × OD663)]/(1,000 × W),
carotenoid (mg·g-1) = (1,000 × OD470–2.05 Chl a–114.8 × Chl b)/245,
where V is the total volume of the acetone extract (mL) and W is the FW (g).
Photosynthetic Characteristics and Chlorophyll Fluorescence
Photosynthetic characteristics were measured using fully expanded third leaves (from the top) of four plants per treatment. Photosynthetic activity was analyzed using a single leaf exposed to light provided by the Li-6400 portable photosynthesis system (ILI-COR, USA). The leaves were exposed to light under saturated CO2 conditions at 25 ± 1°C and 60 to to 70% relative humidity. The LED light source used Li-6400 RB lamps with an intensity of 400 ± 5 µmol·m-2·s-1. Although the leaves were artificially irradiated using different LED sources, the respective light intensities (photosynthetic photon flux density) were all ~400 µmol·m-2·s-1. For each light intensity level, data were obtained when the net photosynthetic rate (Pn) stabilized. Moreover, ratio the transpin rate (Tr), stomatal conductance (Gs), and intercellular CO2 concentration (Ci) were measured.
Chlorophyll fluorescence parameters were measured on the abaxial surface of freshly prepared leaf discs. Plants were incubated in darkness for 30 min prior to analyses. Modulated fluorescence was measured using the PEA portable chlorophyll fluorimeter (version 1.21; Hansatech Instrument Ltd., Norfolk, UK). Four plants were randomly selected, and fully expanded young leaves were analyzed using a standard leaf chamber, with four leaves examined per treatment. The chlorophyll fluorescence images were captured at 22°C according to an experimental protocol involving a -20-min adaptation to darkness followed by measurements of Fo (minimal fluorescence: chlorophyll fluorescence yield after the dark adaptation, which is when all of the photosystem II [PSII] reaction centers and electron acceptor molecules are fully oxidized) and Fm (maximum fluorescence yield in dark-adapted samples measured after a light-saturating pulse of about 1,800 µmol·m-2·s-1 provided by a halogen light source). Then, samples were exposed to orange actinic light (620 nm; 400 µmol·m-2·s-1) for 400 s. Light-saturating pulses ~1,800 µmol·m-2·s-1) were provided every 25 s. This treatment was sufficient for the steady-state fluorescence yield (Ft), and Fm' (maximum fluorescence yield in light-adapted samples) was measured during the last pulse. Fo' (minimum fluorescence yield in light-adapted samples) was recorded after 3 seconds of a far-red light illumination after the orange actinic light treatment. Images were processed using the Fluorcam program program (version 5.0). The maximum quantum efficiency of PSII photochemistry was calculated as Fv/Fm, where Fv = Fm - Fo. The PSII antenna light-trapping efficiency was calculated as Fv'/Fm', where Fv' = Fm' - Fo'. Furthermore, the effective quantum yield of PSII photochemistry (ФPSII) was calculated according to the method developed by Maxwell and Johnson (2000) [i.e. (Fm'- Ft')/ Fm', where Ft'= the steady-state fluorescence under actinic light prior to a saturating pulse]. Photochemical quenching (qP) = (Fm' - Ft)/(Fm' - Fo), and nonphotochemical quenching (NPQ) = (Fm - Fm'). The most representative images are presented.
Stomata Characteristics
The fully expanded third leaves of four plants were sampled for each treatment. The back of the leaves were coated with transparent nail polish prior to observing the stomata. Slides were prepared according to the epidermal fingerprint with nail polish blotting method (Cui et al., 2007) and were observed using a DP71 optical microscope (Olympus Inc., Japan). Stomata length, width, and density were measured using Image-Pro Express software (Olympus Inc.).
Statistical Analysis
Data underwent a one-way analysis of variance (ANOVA), and significant differences between the means were tested using Duncan’s post-hoc test (p < 0.05). All statistical analyses were conducted using the SPSS 19.0 (SPSS, Chicago, USA) program for Windows.
Results
There were considerable differences in growth and morphological characteristics among the G. jamesonii plantlets treated with different LED light conditions (Table 1). Plantlet height exhibited a decreasing trend with increases in the amount of blue LED. The shortest plantlets were those grown under an R:B = 6:4. The number of leaves, leaf length and width, number of roots, and root length tended to increase with the increase of blue light and gradually decreased as the portion of blue light further increased. Maximum leaf width and number of roots were observed in plantlets grown under an R:B ratio of 7:3, while the longest leaves and roots were observed in plantlets grown under an R:B ratio of 6:4 regimen, followed by the R:B = 7:3 regimen.
Table 1. Plant height, leaf number, length of leaf, leaf width, root number, and root length of Gerbera jamesonii plantlets grown in vitro under different ratios of red and blue light
yDifferent letters indicate significant differences using Duncan's multiple range test (p < 0.05; n = 7).
The soluble sugar and protein contents of G. jamesonii plantlets grown under controlled conditions exhibited the opposite tendencies (Table 2). Overall, the soluble sugar content decreased with increasing amounts of blue light. The highest sugar and protein levels were observed in plantlets treated with only red LED, followed by those grown under the R:B ratio of 7:3. On the other hand, the soluble protein content increased with the increasing amount of blue light, peaking in plantlets exposed to either 100% blue or 30% blue LED light.
Table 2. Soluble sugar and soluble protein content content of Gerbera jamesonii plantlets grown in vitro under different ratios of red and blue light
yDifferent letters indicate significant differences using Duncan's multiple range test (p < 0.05; n = 3).
Antioxidant enzyme activities also responded to the addition of blue LEDs (Table 3). When comparing the activities under only monochromatic light, the POD, SOD, and CAT activities were all higher under monochromatic blue LED than under monochromatic red. The lowest POD activity was observed in samples treated with only red light, while the highest activity was observed in plantlets under R:B = 6:4, followed by B and R:B = 5:5. The SOD and CAT activities exhibited a W-shaped trend. Specifically, the activity levels initially decreased, peaked under R:B = 7:3, and then declined again as the portion of blue light further increased. The MDA content initially decreased before increasing, with the highest level observed in plantlets grown under only red light, then reaching its lowest level under R:B = 7:3, before increasing to a second peak under only blue light. The MDA content was higher in plantlets treated with red, blue, or R:B = 5:5 than in the CK plantlets.
Table 3. Antioxidant activities in leaves of Gerbera jamesonii plantlets grown in vitro under different ratios of red and blue light
yLight was supplied by LEDs with different ratios of red and blue light. A halogen light source was used as the control.
xDifferent letters indicate significant differences using Duncan's multiple range test (p < 0.05; n = 3).
The chlorophyll and carotenoid contents were determined in G. jamesonii plantlets cultured under different light qualities (Table 4). The Chl a and Chl b contents both increased under mixed light qualities, but decreased as blue light gained a larger proportion of the irradiance. However, the Chl a/Chl b ratio did change and was highest under only blue light. The highest Chl a and Chl b contents were induced by R:B = 7:3, and the Chl a/Chl b ratio differed significantly under control light, but no under red light only. Increasing the blue light resulted in a decrease in Chl levels. The carotenoid content tended to increase with increasing proportion of blue light, peaking under the blue light only regimen.
Table 4. Chlorophyll and carotenoid levels in leaves of Gerbera jamesonii plantlets grown in vitro under different ratios of red and blue light
yLight was supplied by LEDs with different ratios of red and blue light. A halogen light source was used as the control.
xDifferent letters indicate significant differences using Duncan's multiple range test (p < 0.05; n = 3).
The photosynthetic indices showed various responses in G. jamesonii plantlets grown under various light qualities (Table 5). The Ci value declined as a whole with the addition of blue light, with the minimum value in plants grown under R:B = 6:4. The Tr value was lowest under red light only, increased significantly with increasing amounts of blue light, and peaked under blue light only. However, the Tr value under all LED treatments was lower than that under the CK light condition. The Pn value increased with a little bit of blue light, reaching its maximum value in plantlets grown under R:B = 7:3, and then decreased with a a further increase in the amount of blue light. The Gs value was lowest under red light only, but then increased with the addition of blue light, peaking in plantlets grown under the R:B = 7:3 treatment, before decreasing and then increasing to a second peak under monochromatic blue light. All photosynthetic indices were lower under monochromatic red compared to both monochromatic blue light and composite light treatments.
Table 5. Photosynthetic parameters and size and density of stomata in leaves of Gerbera jamesonii plantlets grown in vitro under different ratios of red and blue light
yLight was supplied by LEDs with different ratios of red and blue light. A halogen light source was used as the control.
xDifferent letters indicate significant differences using Duncan's multiple range test (p < 0.05; n = 3).
Stomata development directly affects photosynthesis and transpiration, which then affects plant growth. Stomata development differed considerably in G. jamesonii plantlets exposed to various red and blue light treatments (Table 5). Higher amounts of red light increased stomata length, while higher amounts of blue light had the opposite effect. Overall, stomata width and density increased as the amount of blue light increased, peaking in plantlets grown under R:B = 7:3, then decreasing under higher proportions of blue light.
Various fluorescence parameters were tracked in G. jamesonii plantlets grown under different light qualities (Table 6). The Fo value increased and then decreased with increasing amounts of blue light, with the peak in plantlets grown under R:B = 7:3 and lowest value under monochromatic blue light. The Fm value increased and then decreased with the addition of blue light, reaching its peak value under R:B = 7:3. The Fm and Fo values were significantly higher under R:B = 7:3 than all other treatments, including the control, and significantly lower under monochromatic blue light. Additionally, Fv/Fm ratio, ΦPSII, NPQ, and qP values tended to increase with the addition of some blue light, peaking in plantlets grown under R:B = 7:3 and then decreasing as the blue light portion increased further. These four fluorescence indices were lower in plantlets grown under monochromatic blue light than in those grown under the control halogen light, except for ΦPSII (for significantly different) and NPQ (not significantly different). In contrast, each of these indices indices was lower under monochromatic red light compared to control conditions.
Table 6. Fluorescence parameters in dark-adapted leaves sampled from Gerbera jamesonii plantlets grown in vitro under different ratios of red and blue light
yLight was supplied by LEDs with different ratios of red and blue light. A halogen light source was used as the control.
xDifferent letters indicate significant differences using Duncan's multiple range test (p < 0.05; n = 3).
The minimal fluorescence yield of dark-adapted leaves (F0) sampled from the G. jamesonii plantlets showed significant differences under the different red and blue light treatment regimens (Fig. 1), as confirmed by the data (Table 6). Additionally, the images show that the Fm values heterogeneously distributed within the leaf, which cannot be gleaned from the tabulated data. The highest Fm intensity values were recorded near the blade edge of leaves taken from plantlets grown under the control halogen lighting and the monochromatic blue lighting regimes (Fig. 1 and Table 6). Another revelation from looking at the leaf images is that the Fv/Fm values also varied within the control leaves, but this difference was not significant (Table 6). The NPQ imaging also showed distinct spatial differences within the leaves of plantlets grown under different light qualities (Fig. 1 and Table 6). Under R:B = 7:3, the NPQ image revealed homogeneity of the parameters within the green area. The value of qP under red light was low, as indicated by both the imaging and the measurements, especially in the green sectors (Fig.1 and Table 6). The effective quantum yield of the PSII photochemistry (FPSII) did not differ in leaves sampled from plantlets grown under different light qualities (Fig. 1), which was inconsistent with the measurement data (Table 6).
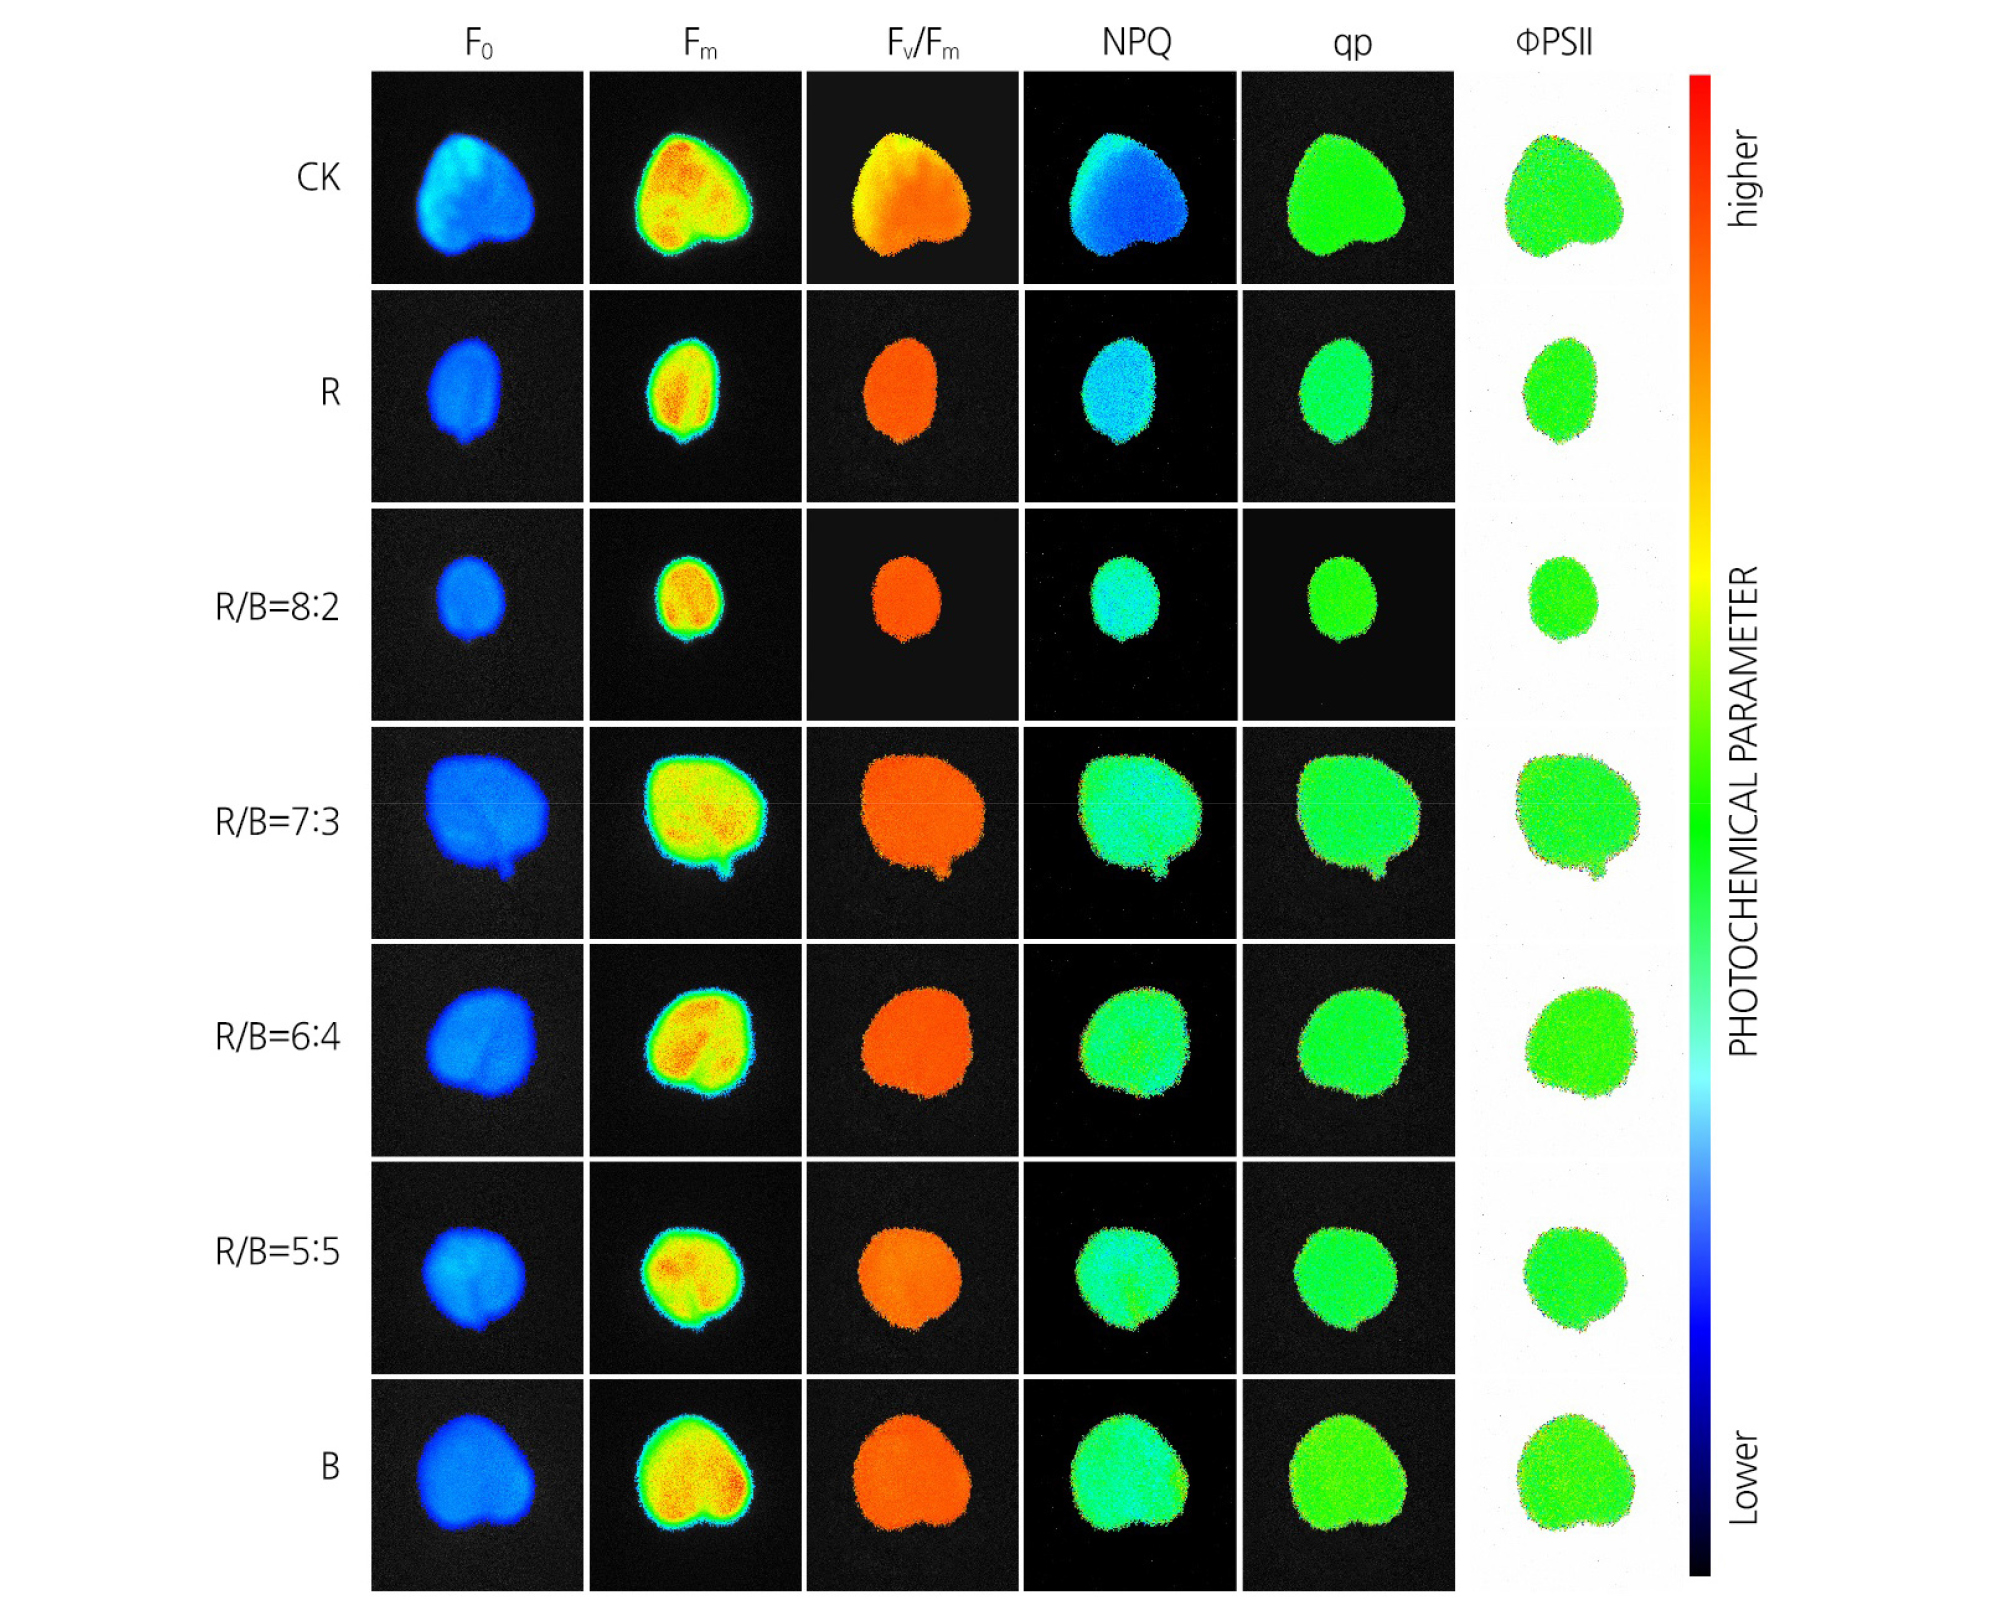
Fig. 1.
Chlorophyll fluorescence in leaves sampled from plantlets grown under different ratios of red and blue light. Leaves were dark adapted and then treated to obtain the Fo, Fm, Fv/Fm, NPQ, qP, and ФPSII values. All images show how leaves sampled from G. jamesonii plantlets grown under the same treatments. The colored bar parallel to the images shows the range of values and how they mapped to the color palette.
Discussion
Red and blue light, either alone or in combination, significantly influenced plant growth (He et al., 2017.). Red light resulted in increases in the number of leaves, the length of leaves, and plant height (Kurilčik et al., 2008; Yang et al., 2015), while blue light produced more leaves and wider leaves (Manivannan et al., 2015). Some research has revealed that a mixture of blue and red light enhanced plant growth better than monochromatic LEDs (Poudel et al., 2008; Luz et al., 2015) and stimulated the growth under controlled conditions of many plant species, including spinach (Matsuda et al., 2008) and grape (Poudel et al., 2008), similar to these these results. G. jamesonii plant height reached the highest under red light and decreased with the addition of blue light, while leaf number first increased with a little blue light, peaked under R:B = 7:3, and then decreased with the addition of more blue light, with no difference induced by only R or B treatments. This observation was dissimilar to earlier research, may be due to differences between the species or varieties of plants tested cultivation conditions, and requires further study. Red light produced longer leaves (Kurilčik et al., 2008; Yang et al., 2015), while blue LEDs produced wider leaves (Manivannan et al., 2015). However, in this study, the length and width of the leaves decreased and and then increased with the addition of blue light, reaching the maximum values under R:B = 6:4 and 7:3, respectively. This showed that red or blue light alone did not significantly affect the length or width of G. jamesonii leaves, while the right proportion of RB light could increase these parameters, indicating that different plants reacted differently to red and blue light. Poudel et al. (2008) reported that grape root number and length under controlled LEDs conditions were optimal under blue light, while red light inhibited root number and length. In our research, the number and length of roots increased first and then decreased with an an increasing proportion of blue light, peaking under a mixture of B and R (R:B = 7:3 or 6:4). Analysis of these morphological indices in G. jamesonii plantlets indicated that red light promoted plantlet elongation, that leaf number, leaf width, and root number were greatest under R:B = 7:3, and that that leaves and roots were longer under R:B = 6:4.
Red and blue light, either alone or in combination, significantly influenced plant growth (He et al., 2017.). Red light resulted in increases in the number of leaves, the length of leaves, and plant height (Kurilčik et al., 2008; Yang et al., 2015), while blue light produced more leaves and wider leaves (Manivannan et al., 2015). Some research has revealed that a mixture of blue and red light enhanced plant growth better than monochromatic LEDs (Poudel et al., 2008; Luz et al., 2015) and stimulated the growth under controlled conditions of many plant species, including spinach (Matsuda et al., 2008) and grape (Poudel et al., 2008), similar to these these results. G. jamesonii plant height reached the highest under red light and decreased with the addition of blue light, while leaf number first increased with a little blue light, peaked under R:B = 7:3, and then decreased with the addition of more blue light, with no difference induced by only R or B treatments. This observation was dissimilar to earlier research, may be due to differences between the species or varieties of plants tested cultivation conditions, and requires further study. Red light produced longer leaves (Kurilčik et al., 2008; Yang et al., 2015), while blue LEDs produced wider leaves (Manivannan et al., 2015). However, in this study, the length and width of the leaves decreased and and then increased with the addition of blue light, reaching the maximum values under R:B = 6:4 and 7:3, respectively. This showed that red or blue light alone did not significantly affect the length or width of G. jamesonii leaves, while the right proportion of RB light could increase these parameters, indicating that different plants reacted differently to red and blue light. Poudel et al. (2008) reported that grape root number and length under controlled LEDs conditions were optimal under blue light, while red light inhibited root number and length. In our research, the number and length of roots increased first and then decreased with an an increasing proportion of blue light, peaking under a mixture of B and R (R:B = 7:3 or 6:4). Analysis of these morphological indices in G. jamesonii plantlets indicated that red light promoted plantlet elongation, that leaf number, leaf width, and root number were greatest under R:B = 7:3, and that that leaves and roots were longer under R:B = 6:4. Sugar and protein are important building blocks for plant growth and development. An earlier study confirmed that light quality may affect soluble sugar content because of differences in the absorption of light by carbohydrates (Matsuda et al., 2008). Moreover, proteins require considerable energy for their synthesis (Cui et al., 2009). Cui et al.(2009) and Lin et al. (2013) found that R was beneficial to the accumulation of soluble sugars but detrimental to accumulation of soluble proteins. The relatively high energy associated with light in the blue spectral region may be responsible for the increase of protein synthesis under B but not R (Lee et al., 2007). Additionally, Wang et al. (2009) and Lee et al. (2007) observed that R could increase the soluble sugar content, while B promoted the accumulation of soluble proteins. In our research, the contents of soluble sugars and soluble proteins exhibited the opposite tendencies. The highest soluble sugar content in G. jamesonii plantlets grown under controlled conditions was observed under R, followed by R:B = 7:3. Meanwhile, the highest soluble protein content occurred under B, followed by R:B = 7:3. These results implied that while R or B alone contribute to the accumulation of soluble sugars or proteins, respectively, an appropriate mixture of these wavelengths could increase both soluble sugars and proteins. This increase in both building blocks under a combined light source agreed with agreed with the data on the morphological indicators.
In plants, oxidant defense systems include various antioxidants, such as carotenoids and a series of antioxidases (POD, SOD, and CAT) that play important roles in protection from photooxidative damage. Carotenoids are strong antioxidants that protect plants from free radicals, while the presence of high antioxidant enzyme activity is important for strong growth of seedlings (Lin et al., 2013). Harmful free radicals (i.e., O2-1) produced in plant cells are removed by SOD and CAT, thereby protecting cells from free radicals and their derivatives. Meanwhile, POD activity directly affects the metabolism and distribution of IAA, which is an important hormone mediating plant growth and development. Strong POD activity enhances the oxidative decomposition of endogenous IAA, resulting in inhibited growth (i.e., dwarf phenotype) (Gupta et al., 2015). Samuoliene et al. (2010) found that carotenoid content is positively correlated with the activity of antioxidant enzymes. Kim et al. (2013) reported that CAT and SOD activities in tomato leaves are higher under B than under R, with similar results observed for Rehmannia glutinosa (Manivannan et al., 2015). We also investigated the antioxidant capacity of the leaves of G. jamesonii plantlets cultivated under different LEDs. The results showed that POD activity was lowest under R and highest under an R:B ratio of 6:4, resulting in excessive growth under R and dwarfed phenotype under R:B = 6:4. The activities of SOD and CAT under monochromatic blue light were higher than under monochromatic red light, with a maximum under R:B = 7:3. Furthermore, the content of MDA influences plant stress resistance, with higher contents leading to greater damage (Liu et al., 2018). Our data indicated that the MDA content decreased with greater exposure to blue light, with the lowest value observed under an R:B of 7:3. Above all, it is clear that plantlets grown under either R or B grew in adversity, while an appropriate proportion of R and B LEDs (R:B = 7:3 or 6:4) optimized plant growth.
Light is an environmental factor that that affects chlorophyll synthesis, chlorophyll content, stomatal movement, and photosynthetic indices, all of which are intrinsic factors that affect the photosynthesis of plants, the changes are unlike anything under different light qualities (Liu et al., 2018). Manivannan et al. (2015) determined that red LEDs had the most positive effect on chlorophyll synthesis in R. glutinosa, while Johkan et al. (2010) reported that that blue fluorescent light positively influenced carotenoid accumulation. Matsuda et al. (2008) reported that plants grown under B had a higher Chl a/Chl ratio than plants under R and that an appropriate R:B treatment affected growth parameters better than monochromatic light. In our study, Chl a and Chl b contents were significantly higher in plants grown under R than in those grown under B, but the highest value was for plantlets grown under an R:B ratio of 7:3. These data showed that an appropriate proportion of red and B LEDs was more beneficial to the synthesis of chlorophyll. The carotenoid content and the Chl a/Chl bratio increased with the proportion of B, peaking under monochromatic B LEDs, suggesting that the increase of blue light was beneficial to the transformation of Chl b to Chl a, which would then result in increasing photosynthesis. The concomitant increase in carotenoid content would balance the increased photosynthetic production of free radicals in the plantlets.
Stomata are the main route for the exchange of gases required and produced by photosynthesis. Stomatal development directly affects photosynthesis and transpiration, with implications for plant growth. The opening and closing of the stomata are closely related to the concentration of carbon dioxide, while stomata opening induced by blue light may help to increase photosynthetic productivity (Darko et al., 2014; Muneer et al., 2014). High-intensity blue LEDs were found to maintain the integrity of chloroplast proteins by controlling stomata movement (Muneer et al., 2014). An increase in the abundance of stomata also leads to enhanced carbon dioxide (CO2) absorption by leaves (Yao et al., 2017). Blue LED treatments resulted in the most stomata in grape samples and Tagetes erecta (Heo et al., 2002). Additionally, in tomato leaves, the width of stomata was greater under B than under R (Kim et al., 2013), while the opposite relationship was observed in Salvia splendens (Heo et al., 2013). We found that stomata numbers were greater under B than R, but that the largest number appeared under R:B = 7:3. These differences may be species dependent. Some researchers have described the effect of light on the number and size of stomata (Poudel et al., 2008; Macedo et al., 2011). An increase in stomata size may increase the internal surface area of leaves, with more robust aerenchyma improving photosynthetic efficiency (Pohl et al., 2011). In histhis study, stomata density was lower under B than under R, but was highest under R:B = 7:3.
A larger stomatal aperture can improve photosynthetic efficiency because more CO2, the raw material of photosynthesis, can enter the the leaf cell. With an increase in the intercellular CO2 concentration(Ci), the net photosynthetic rate (Pn) declines accordingly (Pohl et al., 2011). Meanwhile, a change in the stomata conductance (Gs) also affects the Pn value. IfGs increases, more CO2 enters cells, leading to more CO2 for photosynthesis and, thus, a greater Pn. This was observed in our experiments. The value of Ci reached its maximum under R and dropped off with the addition of blue LEDs, while the values of Tr, Pn, and Gs followed the opposite trend. When the suitable proportion of red and blue LEDs (R:B = 7:3) was applied, the values of Ci, Tr, Pn, and Gs came together to promote growth G. jamesonii plantlets. In this study, stoma density was lower under B than under R. Stoma density was highest under R:B = 7:3, as were the Pn and growth. While the Gs and Tr of plantlets grown under B reached their maximum values, the Pn was lower than under most other treatments, and plantlets did not achieve their best growth. These results showed that the growth of plants was not controlled by a single factor nor it could it be measured by a single indicator.
Fluorescence parameters provide the most direct evidence of the levels of the photosynthetic pigment and can reflect the level of photosynthesis within a plant. The pigment content is the basis for the interpretation of some CF parameters (Muniz et al., 2014). In the blue and orange sector of leaves, the Fo and Fm values were low when compared to the other areas due to the low content of photosynthetic pigments. Therefore, in these areas, other parameters, such as Fv/Fm, qP, and NPQ, also remained low, indicating diminished photochemical capacity of PSII, low amount of PSII reaction centers, and less energy availability due to the lack or low level of carotenoids (Sofo et al., 2009). Fo is a fixed parameter and reflects the fluorescence yield of PSII, which is related to the chlorophyll concentration in the leaves. Fm is the fluorescent parameter with the largest production, which reflects the electron transfer through PSII. Fv/Fm is used to characterize the efficiency of light energy conversion by PSII, which represents an important index for assessing photoinhibition. The Fv/Fm ratio may also be useful for determining the maximum photochemical yield of PSII in the dark-adapted state (Daood et al., 1989; Reay et al., 2015; Akcin et al., 2016). Healthy plant samples are associated with a maximum Fv/Fm value of 0.850 (Reay et al., 2015) or 0.830 (Daood et al., 1989). qP reflects the ability of PSII to perform photochemical reactions under light adaptation. NPQ is a measure of the mechanism by which plants protect themselves against excess excitation energy through carotenoids (Wang et al., 2010). Meanwhile, qP reflects the relationship between photochemical electron transfer and the light energy absorbed by the PSII antenna pigment (Cao et al., 2013). The qP value also represents the openness of the PSII reaction center to some extent (Sawicki et al., 2017). In In our study, we found that the Fo value value reached to aa maximum under R and decreased with the addition of blue LED light light, while while the Fm increased with the addition of blue light and reached its maximum under R:B = 7:3. The data presented here indicate that an R:B ratio of 7:3 yielded the highest Fv/Fm and ΦPSII values in G. jamesonii plantlets under control conditions. Moreover, the NPQ value was the lowest and highest under R and B respectively, suggesting B may inhibit the PSII electron transfer system. We also observed a gradual increase in the qP value with the addition of B, and the qP value peaked under R:B = 7:3. The changes in the different fluorescence values values could be observed directly (Fig. 1). When these observations were combined with the data provided in Table 6, it is clear that an appropriate R:B ratio is required to enable LED-treated plants to fully self-regulate and optimally absorb and transform light energy.
Different ratios of R and B LEDs influenced the density and size of leaf stomata, which resulted in changes in the photosynthetic indices (Kim et al., 2004). The Ci, Tr, Pn, and Gs parameters reflected the photosynthetic capacity due to altered levels of chlorophyll in the plants (Lee et al., 2007). The concentration of chlorophyll in the plant is directly related to the fluorescence reaction, which determines whether plants can effectively convert light energy into chemical energy, and since chemical energy eventually forms the sugar and protein needed for plant growth, increased photosynthesis shown as plant growth (Akcin et al., 2016).
In our study, we found that monochromatic R resulted in the tallest G. jamesonii plantlets, longest stomata, highest soluble sugar content, and largest Ci value. Monochromatic B facilitated the greatest accumulation of soluble protein, Chl a/Chl b, and carotenoids. A combination of 60% red LED and 40% blue LED light was ideal for enhancing leaf length, root length, and POD activity. A combination of 70% red LED and 30% blue LED light light had the most positive effects on the number of leaves, leaf width, number of roots, SOD and CAT activities, chlorophyll synthesis and accumulation, and fluorescence parameters. Since most of the indicators mentioned above performed better under an R:B ratio of 7:3 than under the other tested ratios, we conclude that an R:B of 7:3 represents the ideal LED treatment for improving G. jamesonii growth and photosynthetic activities under controlled conditions.
