

Introduction
Materials and Methods
Plant Materials
Data Acquisition and Preprocessing of Hyperspectral Image
Extraction of Region of Interests (ROI)
Classification and Visualization of the Diseased Area using PLS-DA
Software
Results
Digital and Hyperspectral Images
Spectral Reflectance of Watermelon Leaves Infected with BFB
Extraction of the Diseased Area
Classification Accuracy using PLS-DA Model
Visualization
Discussion
Hyperspectral Reflectance of Watermelon Leaves Infected with BFB
Extraction of the Diseased Area
Classification Accuracy and Visualization using PLS-DA Model
Introduction
Bacterial fruit blotch (BFB), caused by Acidovorax avenae subsp. citrulli, is one of the most common, widely destructive diseases of cucurbitaceous crops (Willems et al., 1992; Li et al., 2013). BFB can be introduced into cucurbit fields through contaminated seeds or infected transplants. Dense plant populations and high relative humidity often bring about the occurrence of BFB in nurseries (Dutta et al., 2012). Moreover, overhead irrigation easily spreads the pathogen between plants and can rapidly cause a large section of a greenhouse to become infected with BFB. Cucurbits infected with BFB show seedling blight, leaf lesions, and fruit symptoms (Walcott et al., 2003). There is a time lag between infection and symptom development, so plants may remain symptomless for several days after infection. Therefore, early detection of BFB symptoms is required for reducing production and economic losses of cucurbits and preventing the spread of diseases.
Various disease detection techniques have been applied to diagnose the presence of diseases in plants. Molecular techniques to detect disease infection such as enzyme-linked immunosorbent assay, real-time polymerase chain reaction, and DNA microarrays involve destructive sampling and are time-consuming. In spite of the availability of these techniques, there is a demand for a fast, sensitive, and reliable method for the rapid detection of plant diseases (Sankaran et al., 2010).
Until now, several spectroscopic and imaging techniques (Lins et al., 2009; Rajendran et al., 2016; Wetterich et al., 2016) have been reported for the detection of symptomatic and asymptomatic plant diseases. These techniques are unique disease monitoring methods that have been used to detect diseases and stress due to various factors in plants. However, spectroscopic methods are limited compared with hyperspectral imaging (HSI) techniques because they acquire spectral data from a single point or from a small portion of the tested sample (ElMasry et al., 2007).
HSI is an emerging, rapid, and non-contact analytical method that combines the features of spectroscopy and imaging in a single system to acquire spectral and spatial information simultaneously from the target (Jiang et al., 2018). The HSI technique has been widely applied to diagnose plant disease (Yuan et al., 2014; Mahlein et al., 2017), plant stress (Mo et al., 2015; Mishra et al., 2017), moisture content (Deng et al., 2015; Jang et al., 2018), chlorophyll content (Sun et al., 2017; Jang et al., 2018), fruit ripeness (Zhang et al., 2016), and food inspection (Kandpal et al., 2015; Siedliska et al., 2018).
In HSI analysis, the average spectrum of all pixels of the pre-defined sample region can be used to build regression or to develop classification models for discrimination of agricultural products. The spectrum of each pixel can also be used for prediction to acquire chemical or category information of the pixel by the established models to visualize a prediction result. Dealing with the immense amount of data generated by HSI is a primary application challenge (Zhang et al., 2016). The spectral bands of hyperspectral images are highly correlated, resulting in collinearity and redundant information. Noises and useless information in the data are the main factors affecting the data analysis results; such as, reducing these factors is an important consideration in HSI analysis (Qin et al., 2013). Principal component analysis (PCA) and partial least squares-discriminant analysis (PLS-DA) are widely used for dimensionality reduction, feature extraction and discriminant analysis of high-dimensional data. The great power of HSI resides in its capability to deal with spectral as well as spatial information (ElMasry et al., 2007). To accomplish this capability, researchers tend to utilize their algorithms that can be used for predictive and descriptive modelling as well as for discriminative variable selection (Lee et al., 2018).
The aims of the present study were to extract the infected area in watermelon seedlings infected with BFB using near-infrared HSI, to compare the spectral reflectance of watermelon leaves taking into consideration the inoculation concentration and time following inoculation of BFB, and to evaluate the infection accuracies using PLS-DA.
Materials and Methods
Plant Materials
A total of 100 watermelon (Citrullus lanatus cv. Sambogkkul, Farm Hannong Co., Korea) seedlings with two true leaves were used as experimental plant materials in this study. Plants were grown in a walk-in chamber with a photoperiod of 16/8 h (day/night), air temperature of 26/20°C (day/night), relative humidity of 65%, and photosynthetic photon flux of 200 µmol·m-2·s-1. Three concentrations (1 × 10², 104, 106 cfu/mL) of Acidovorax avenae subsp. citrulli were inoculated on the first true leaves of 25 watermelon seedlings using a syringe, while 25 non-inoculated seedlings were used as a control.
Data Acquisition and Preprocessing of Hyperspectral Image
The hyperspectral imaging (HSI) system was designed to acquire the sample spectra in the near-infrared range (NIR, 900 - 1,700 nm). The system consisted of a NIR hyperspectral camera (SPECIM FX17, Spectra Imaging Ltd., Finland), two 150 W halogen lamps (93638EKE, Osram, Germany), and a 640 × 440 mm2 sample plate (Fig. 1). The hyperspectral camera combined with an indium gallium arsenide detector acquired HSI by scanning line by line, yielding the three- dimensional hypercube data with dimensions of 640 (pixels) × 972 (lines) × 224 (bands). The camera was mounted at 50 cm above a sample plate. The illumination sources were placed in two opposite frames positioned at an angle of 60° towards the sample plate. The speed of the sample plate was adjusted by a motorized actuator (EZSM4E065K, Oriental Motor Ltd., Japan) at a speed of 0.1 m·s-1. The exposure time and frame rate were optimized at 10 ms and 40 fps, respectively.
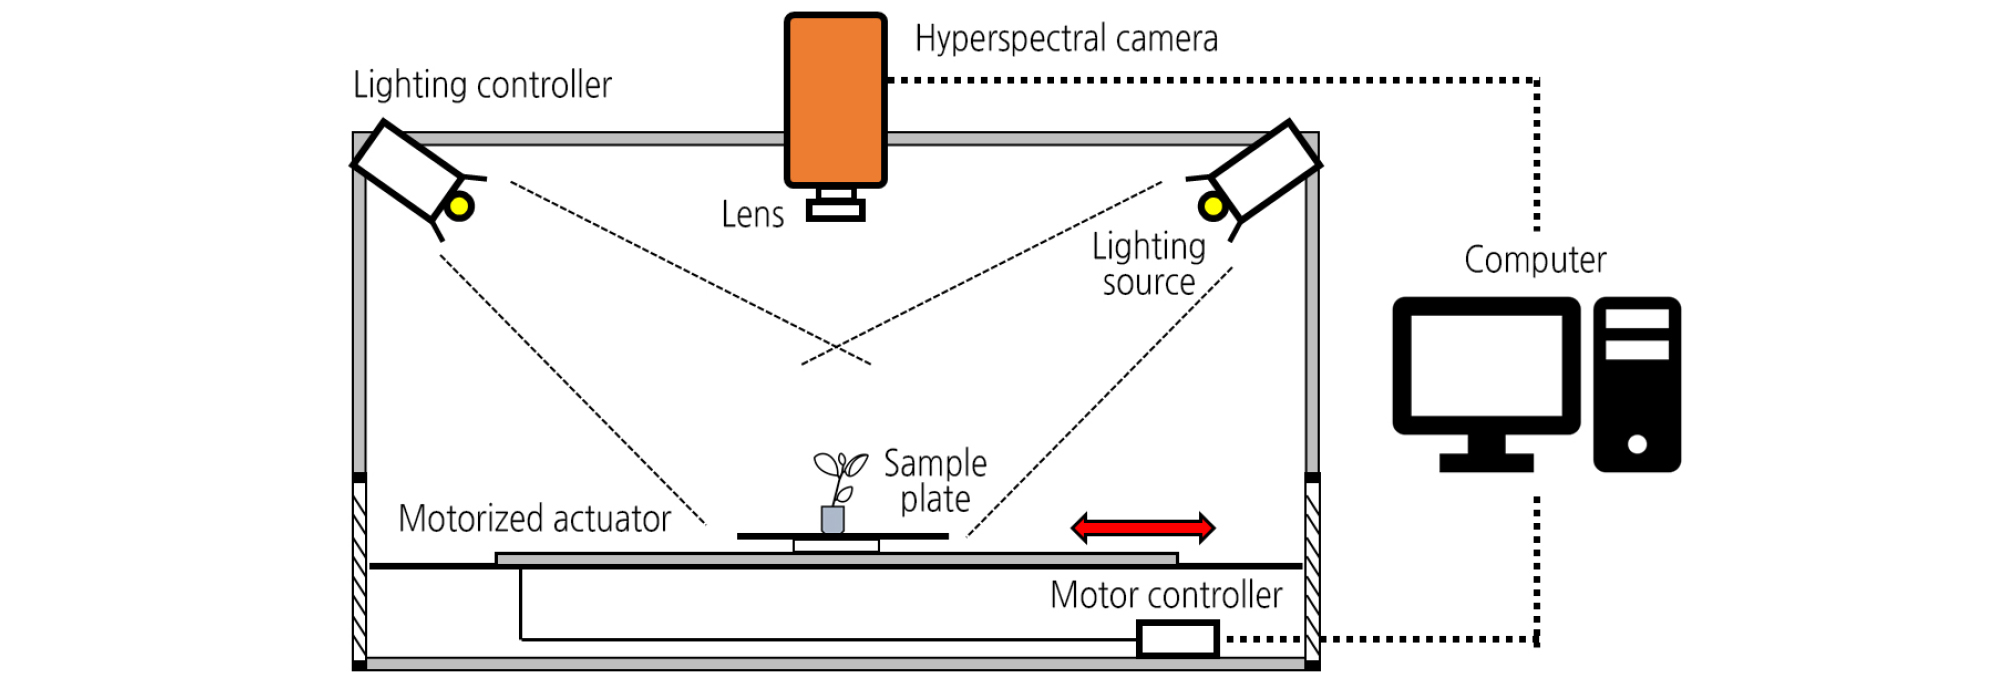
A total of 500 images (25 samples × 4 treatments × 5 days) were captured for 100 samples placed on the sample plate at 1 - 5 days after inoculation (DAI). Measurements were performed in a dark room controlled at an air temperature of 22°C to prevent the influence of external illumination. The HSI data obtained during the measurements were recorded using data acquisition software (Specim Lumo, Spectral Imaging Ltd., Finland). Before capturing the HSI data, digital images of the samples were acquired by a digital camera (D90, Nikon, Japan). The original images obtained with the HSI system were subject to brightness correction using the following equation:
| $$I_R=\frac{I_r-I_d}{I_w-I_d}$$ | (1) |
where IR is the relative reflectance of the hyperspectral image, Ir is the raw image data, Iw is the white reference image data, and Id is the dark-current image data.
The dark current image was obtained by a complete covering of the camera lens with an opaque cap, and a white reflection image was obtained using a white reference plate (SRT-99-100, Labsphere, USA) with 99% reflectivity. A Savitzky-Golay filter with a 5-point moving average and a second-order polynomial was used for smoothing of brightness-corrected images in the present study. To remove background from the HSI, an 1,100 nm image presenting the highest intensity in the hyperspectral image was used with a 0.3 threshold value.
Extraction of Region of Interests (ROI)
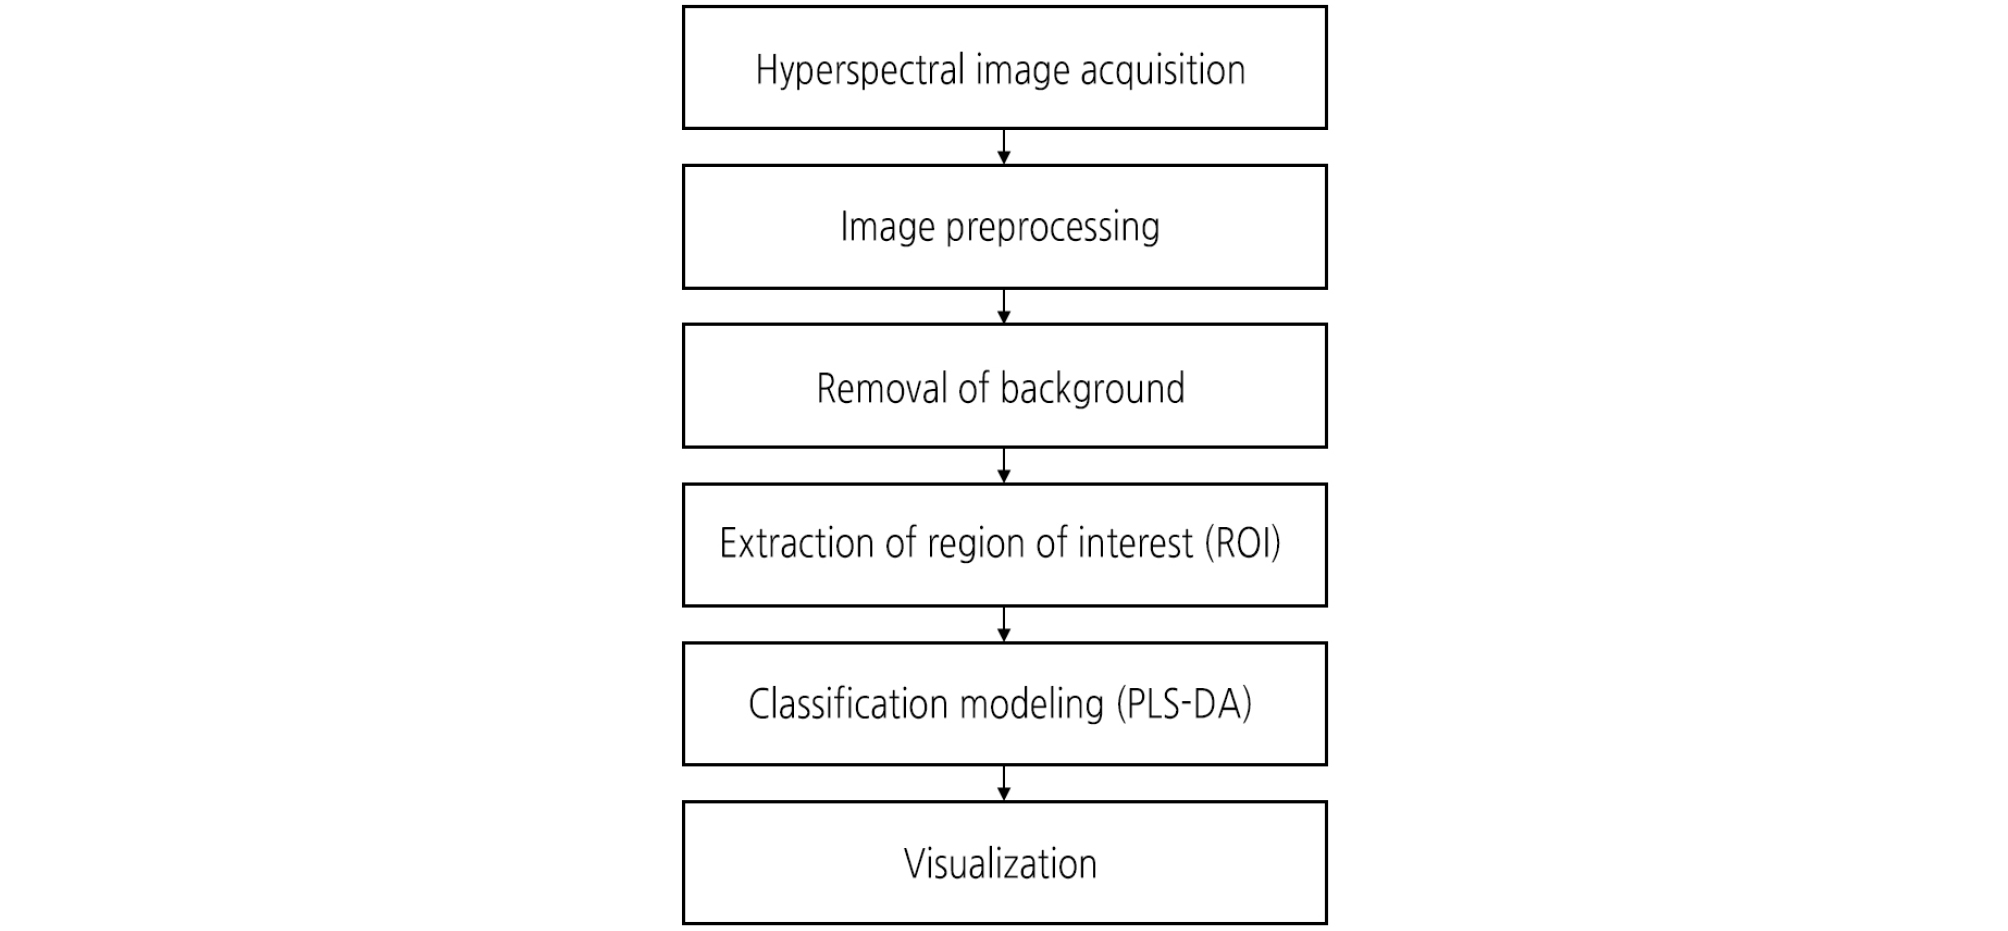
The ROI including the diseased area of each sample was extracted from the preprocessed HSI data. Fig. 2 illustrates the procedure for pre-processing, extraction of ROIs, and analyzing HSI data. Two methods, band ratio and principal component analysis (PCA), were applied to extract the ROI. Band ratio images can effectively enhance the contrast between bands and produce an image of relative band intensity (Huang et al., 2016). In the present work, two bands were taken for enhancing the contrast of the preprocessed HSI and thus producing more uniform responses across the leaves surface. Ratio image is defined using the following equation:
| $$Q_{a/b}=\frac{R_a}{R_b}$$ | (2) |
where Qa/b represents a quotient of spectral reflectance, and Ra and Rb\ are reflectance intensities at a nm and b nm, respectively. Selection of the most significant wavelengths for the extraction of the diseased area was based on t values from a t-test between the two groups (i.e., healthy and infected areas) since our focus was to find an optimal band ratio for classifying those two groups.
PCA was also used to extract the ROI and to discriminate between non-infected and infected leaves. Loadings of the wavelengths in each principal component (PC) indicated the contributions of the wavelengths. The wavelengths with higher absolute loading value had greater contributions. The peaks and valleys of each loading plot were selected as optimal wavelengths (Rodriguez-Pulido et al., 2013). The first few PCs could explain most of the variance, and loadings of these PCs were used to calculate the PC image at each wavelength as shown in the following equation:
| $$PC_{img}=\sum_{i=1}^n\omega_iH_i$$ | (3) |
where PCimg is the PC image, ωi is the weighting coefficient, and Hi is the image at the i th wavelength of a total of n spectral images.
Weighted values were calculated based on a covariance matrix of the images. An image of 20 × 20 pixels, which included a spot on the leaves inoculated with concentrations of either 1 × 10⁴ cfu/mL or 1 × 10⁶ cfu/mL, was extracted from each PC image.
Classification and Visualization of the Diseased Area using PLS-DA
Partial least squares-discrimination analysis (PLS-DA) is an adaptation of PLS regression method with a categorical independent variable. Among 500 images acquired in this study, 200 images for the treatments of 1 × 10⁴ and 1 × 10⁶ cfu/mL concentrations were used for PLS-DA modeling and 50 images for visualization. In the current study, the independent variables for two groups (i.e., healthy and diseased areas) were set as 1 and 2, respectively. The hyperspectral images used for PLS-DA were randomly divided into calibration and validation sets consisting of 70% and 30%, respectively. The calibration data set was used to build the classification model, while the validation data set was used to test its capability of classifying new samples. The comparison between the two groups was based on the overall accuracy of the classification model in the calibration and validation sets. Accuracy was determined by the percentage of correctly classified samples and the sensitivity and specificity of each class for PLS-DA classification techniques (López-Maestresalas et al., 2016).
The sensitivity and the specificity are defined as follows:
| $$Sensitivity=\frac{TP}{TP+FN}$$ | (4) |
| $$Specificity=\frac{TP}{TN+FP}$$ | (5) |
where TP (true positive) is the proportion of samples belonging to class A that are correctly classified, FP (false positive) is the proportion of samples belonging to another class B, which are classified as class A, TN (true negative) is the proportion of samples belonging to another class B, that are correctly classified as class B, and FN (false negative) is the proportion of samples belonging to class A that are falsely classified as class B. Sensitivity and specificity values ranged between 0 and 1.
The resultant PLS-DA image was constructed using the beta coefficients of the proposed PLS-DA model that were weighted coefficients of independent variables. For discrimination purposes, the PLS-DA binary image was created by applying a threshold value of 1.5.
To display the diseased proportion information in a spatial domain, a visualization map was generated by applying the PLS-DA model to each pixel’s spectra of the image. Thus, the HSI was transformed into a two-dimensional matrix, and then the matrix was multiplied with the beta coefficients obtained from the best partial least squares regression model. A two-dimensional color image was plotted to show the distribution of diseased area in watermelon leaves.
Software
Spectral data and feature extraction were implemented in ENVI (V5.4, L3HARRIS, USA). T-test, PCA, PLS-DA model, and visualization were performed using MATLAB (R2019a, The Math Works, USA).
Results
Digital and Hyperspectral Images
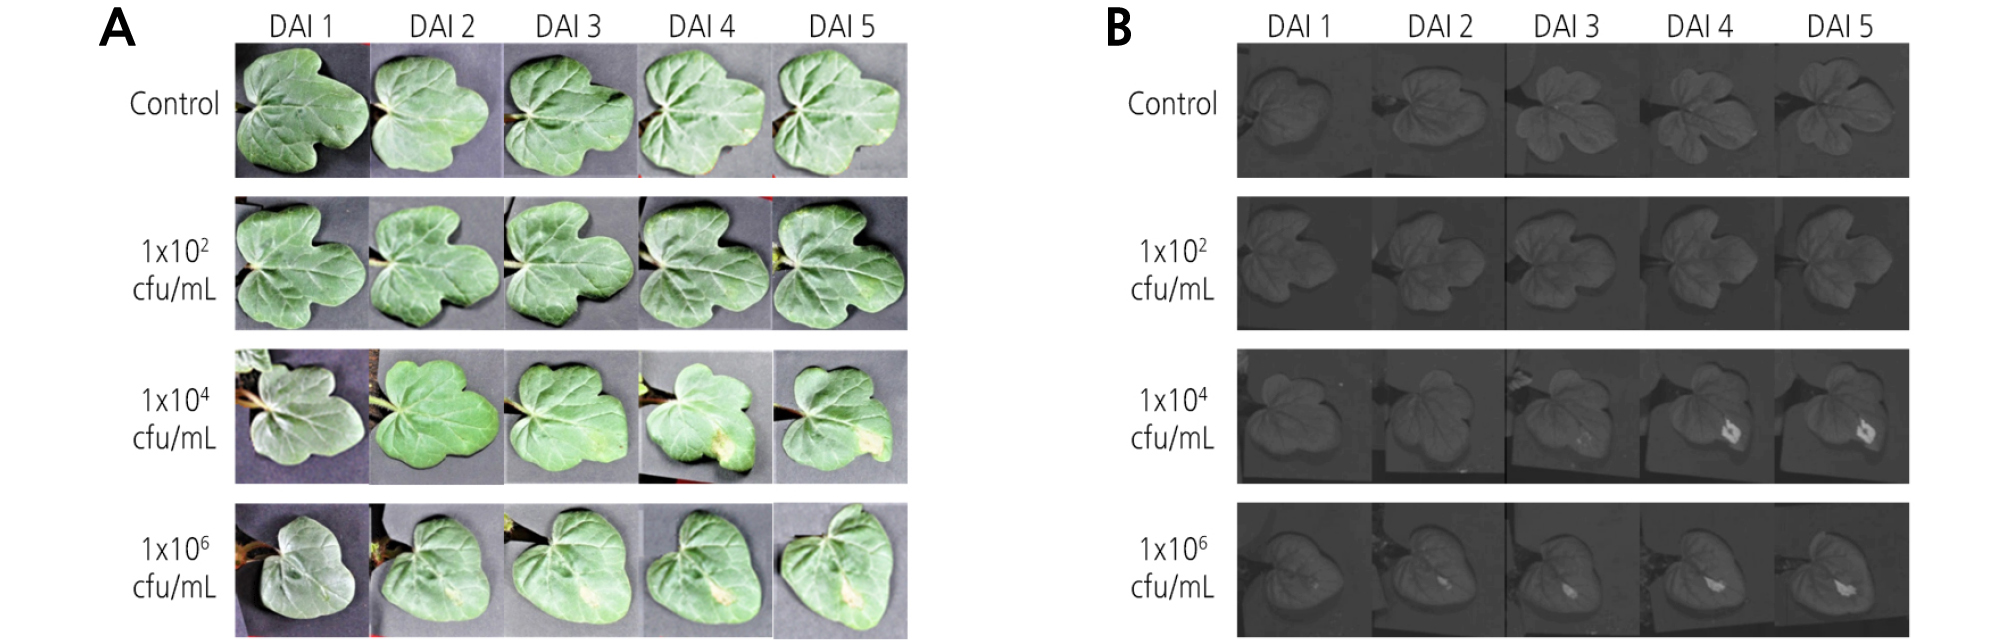
Digital images and HSI of watermelon leaves obtained from different inoculation concentrations of Acidovorax avenae subsp. citrulli and DAI were shown in Fig. 3. In the digital images, it was not possible to visually detect BFB symptoms at the inoculation concentration of 1 × 10². However, the diseased area was noticed from 4 DAI at the 1 × 10⁴ concentration treatment and from 3 DAI for the 1 × 10⁶ concentration. For non-preprocessed HSI displayed at a wavelength of 1,400 nm, similar results were obtained. That is, the detection of BFB symptoms was not detected at a concentration of 1 × 10². Disease symptoms were clearly observed from 4 DAI at the 1 × 10⁴ concentration and from 3 DAI for the 1 × 10⁶ concentration. Even though small symptoms at 2 DAI for the 1 × 10⁶ concentration were marked in the vicinity of the leaf vein, the results were not so clear. Hence, it was presumed that at least 3 - 4 days were required to visually detect disease symptoms in watermelon leaves infected with BFB.
Spectral Reflectance of Watermelon Leaves Infected with BFB
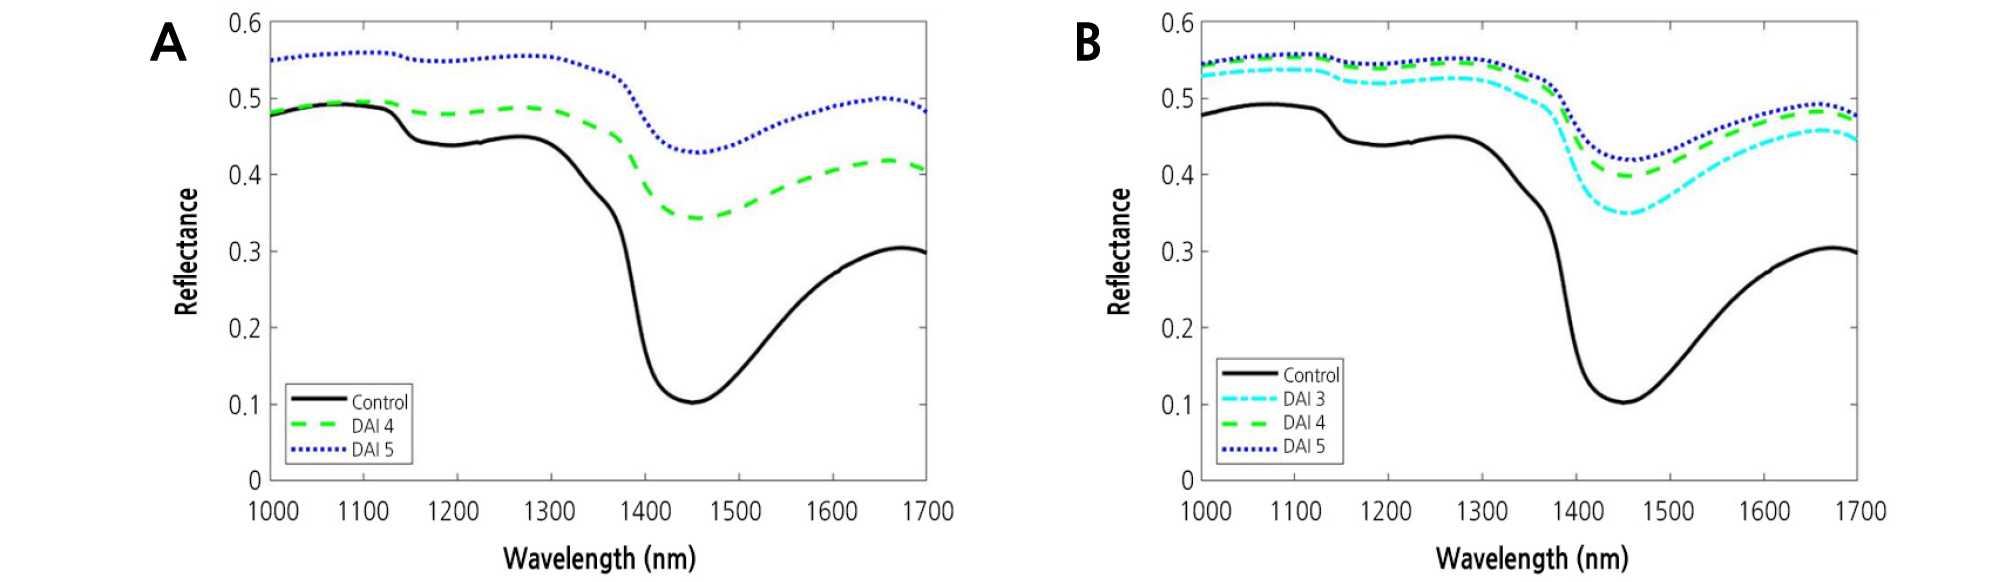
The mean ± standard deviation reflectance spectra obtained from the NIR hyperspectral imaging systems were shown in Fig. 4. It can be seen that the variation is higher in the region between 1,370 and 1,530 nm. In Fig. 5, the mean spectra obtained at different concentration were plotted in order to investigate any possible differences between DAI. From Fig. 5, it can be seen that the mean spectra for the samples infected with BFB were higher than those for the healthy samples (control) in the NIR spectral range. Mean spectra for samples increased with increasing DAI. This result was distinctly observed at the higher concentration. The color and size of diseased spots often change as the disease symptoms in plant leaves develop. These changes not only bring about increased susceptibility to other pests and pathogens, but also accelerate water loss. Compared to the control, there was a substantial increase in reflectance around 1,450 nm.

Extraction of the Diseased Area
The band ratio algorithm was applied to extract the disease symptom on the leaves infected with BFB. Afterwards, selection of the most significant wavelength for detection of the diseased area in watermelon leaves was performed by using t values from the t-test between the two groups of infected and healthy leaves. The t values for infected and healthy areas were calculated for all 199 possible bands in the 1,000 - 1,700 nm region to find the most effective wavelength for differentiating between the two groups. A larger t value indicates a more statistically significant difference between the two groups. The result showed that the means of the two groups were most significantly separated by a two-band ratio at 1,588 and 1,450 nm wavelengths (Fig. 6). These two selected wavelengths were used to extract the diseased area on watermelon leaves infected with BFB. Regardless of the inoculation concentration, bacterial disease symptoms were clearly observed in binary images (Fig. 7A and 7B).
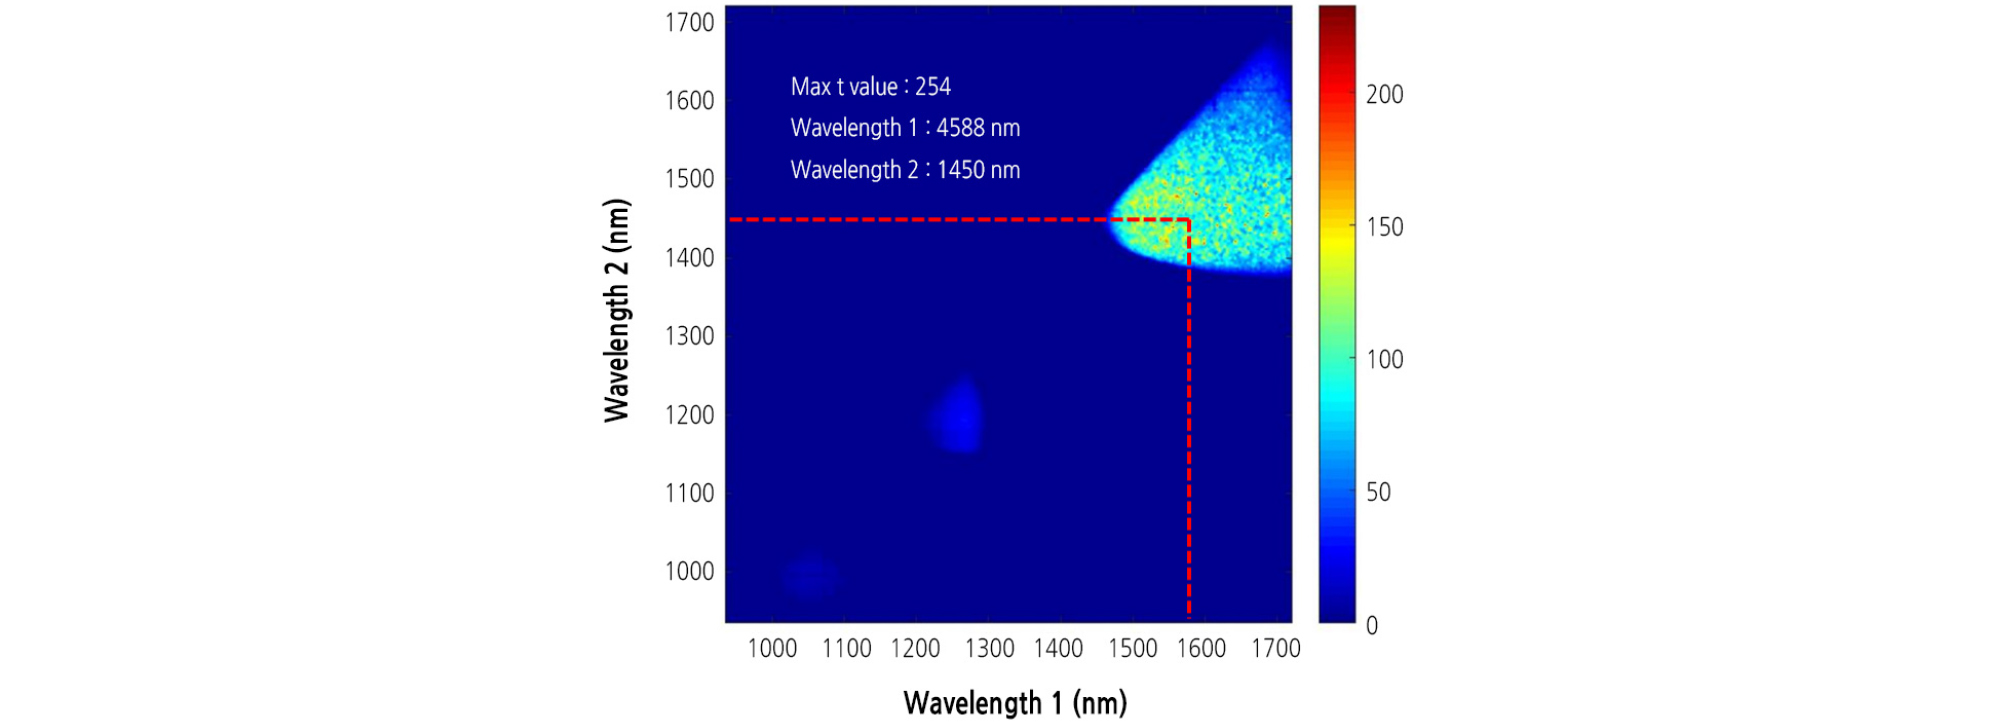
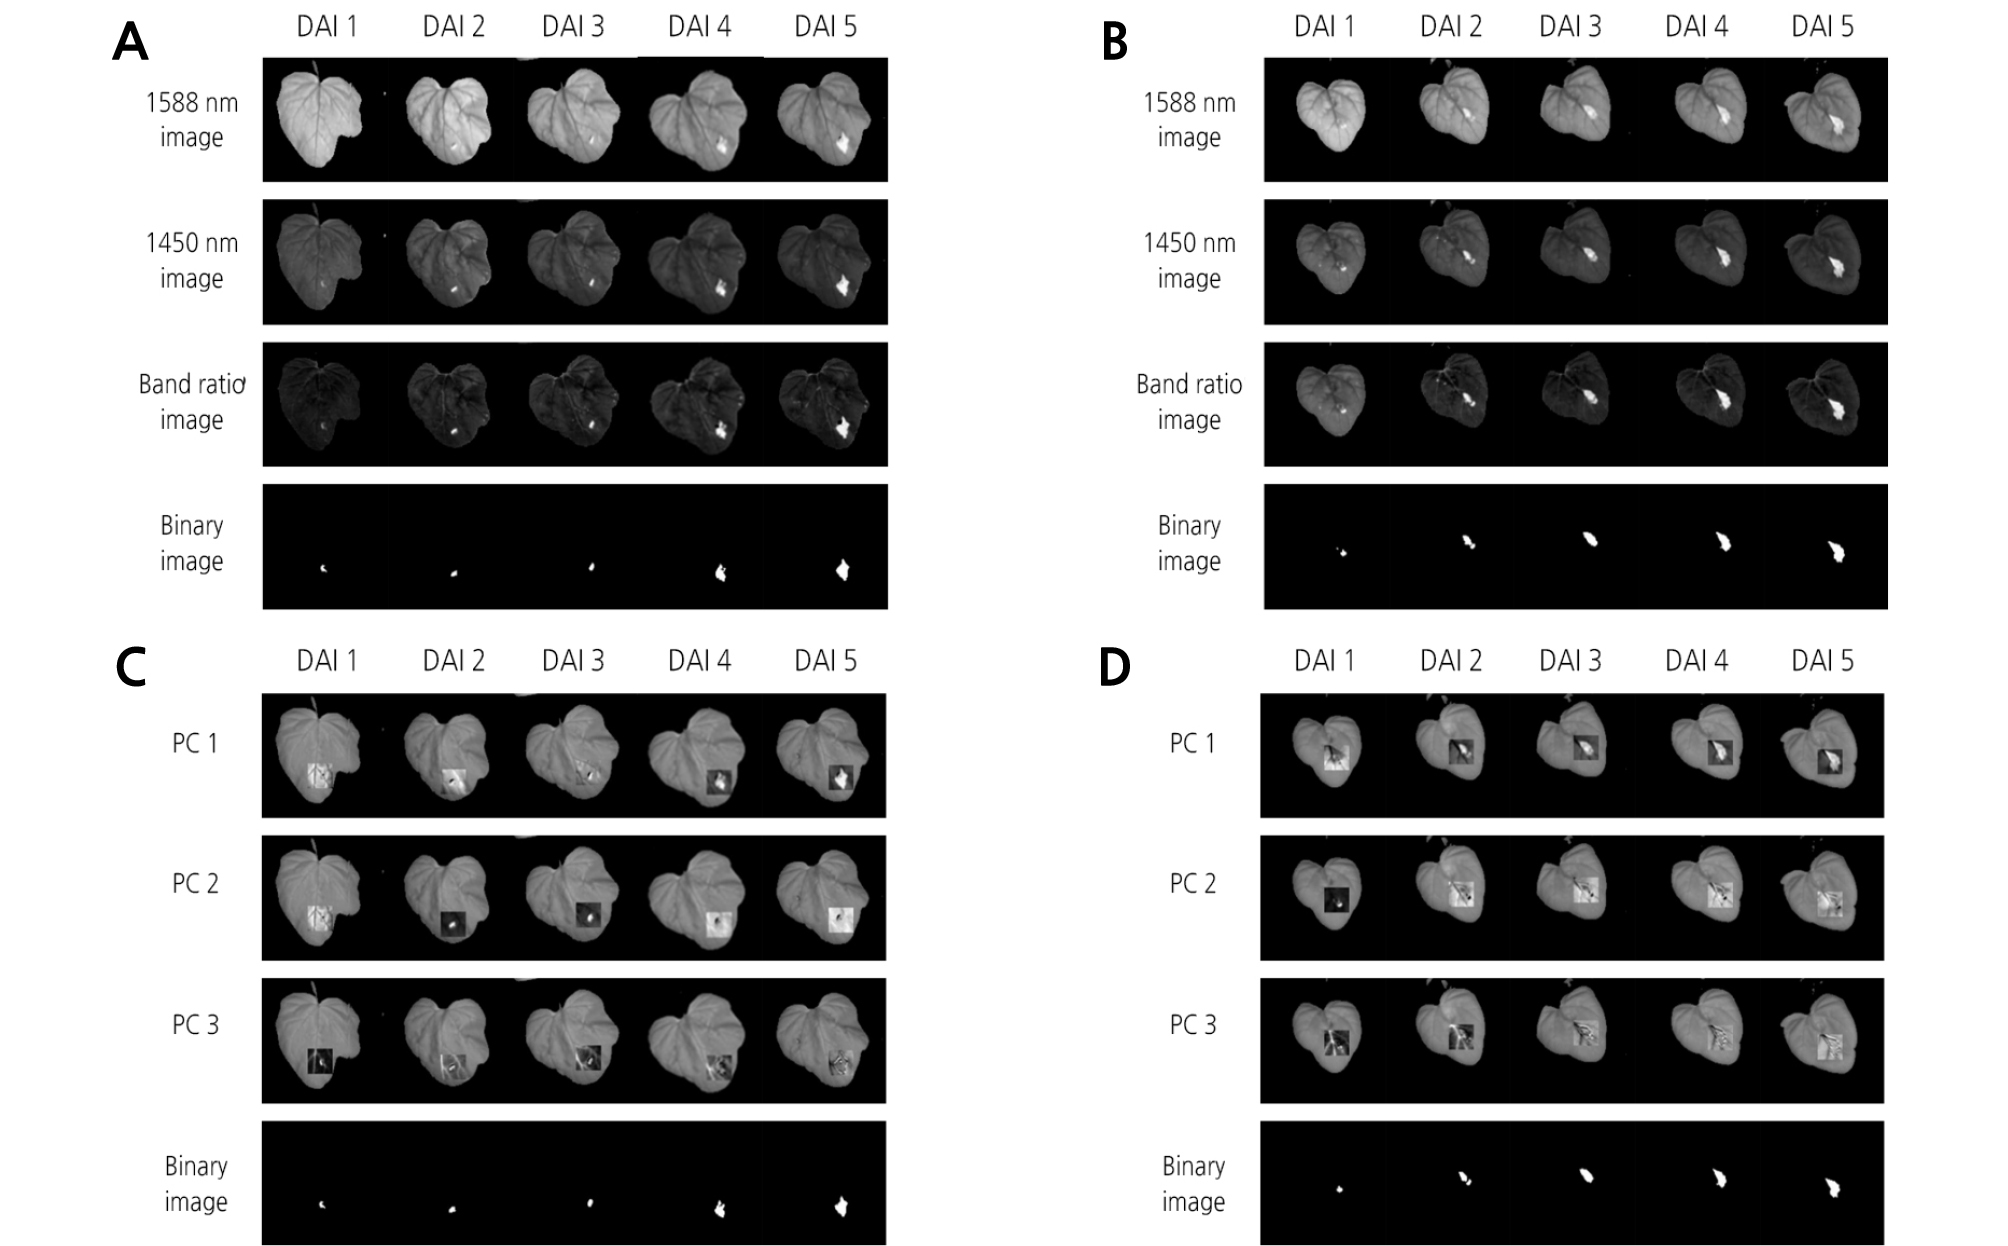
Fig. 7.
Extraction of the diseased area on watermelon leaves infected with BFB using significant wavelengths in the hyperspectral images. Diseased areas as affected by the days after inoculation (DAI) were extracted by two-band ratio and principal component analysis (PCA) methods. (A) two-band ratio, 1 × 10⁴ concentration; (B) two-band ratio, 1 × 10⁶ concentration; (C) PCA, 1 × 10⁴ concentration; (D) PCA, 1 × 10⁶ concentration.
PCA for the image of 20 × 20 pixels including an inoculation spot was executed to discriminate between non-infected and infected leaves. PC images were obtained (Fig. 7C and 7D) and then added to hyperspectral images at 1,450 nm. PC1 image showed features that led to the largest variance of the data, which exhibited large variation between diseased and healthy areas. Subsequent PC images depicting other features were ordered with respect to variations in spectral responses. Different PC images were implemented to discriminate between diseased and healthy areas. For instance, PC3 image was appropriate for masking images at 1 DAI with 1 × 10⁴ concentration, PC2 image for the images at 2 - 3 DAI, and PC1 image for the images at 4 - 5 DAI. For the 1 × 10⁶ concentration, PC2 image was appropriate for the images at 1 DAI, while PC1 image was used for the images at 2 - 5 DAI. Finally, the diseased areas were extracted from binary images.
Classification Accuracy using PLS-DA Model
PLS-DA was performed for analyzing the relationship between defined sample groups. A model was developed to detect bacterial-infections in watermelon data extracted by band ratio and PCA methods. Table 1 shows the classification results for the detection of watermelon seedlings using NIR spectra according to the preprocessing and used region of wavelength. When a PLS-DA model based on two-band ratio was applied, the sensitivity values obtained from the model were 0.95 for calibration and 0.93 for validation. Furthermore, the specificity values for two-band ratio were 1.00 for both calibration and validation sets. For the model extracted by PCA, the sensitivity values for calibration and validation were 0.87 and 0.83, respectively. The specificity values for PCA were 0.99 for calibration and 1.00 for validation. The model based on two-band ratio revealed better classification accuracies to distinguish diseased areas from watermelon leaves.
Table 1. The sensitivity and specificity obtained by PLS-DA model
| Data set | Class | Sensitivity | Specificity |
| Band ratio | Calibration Validation | 0.95 0.93 | 1.00 1.00 |
| PCA | Calibration Validation | 0.87 0.83 | 0.99 1.00 |
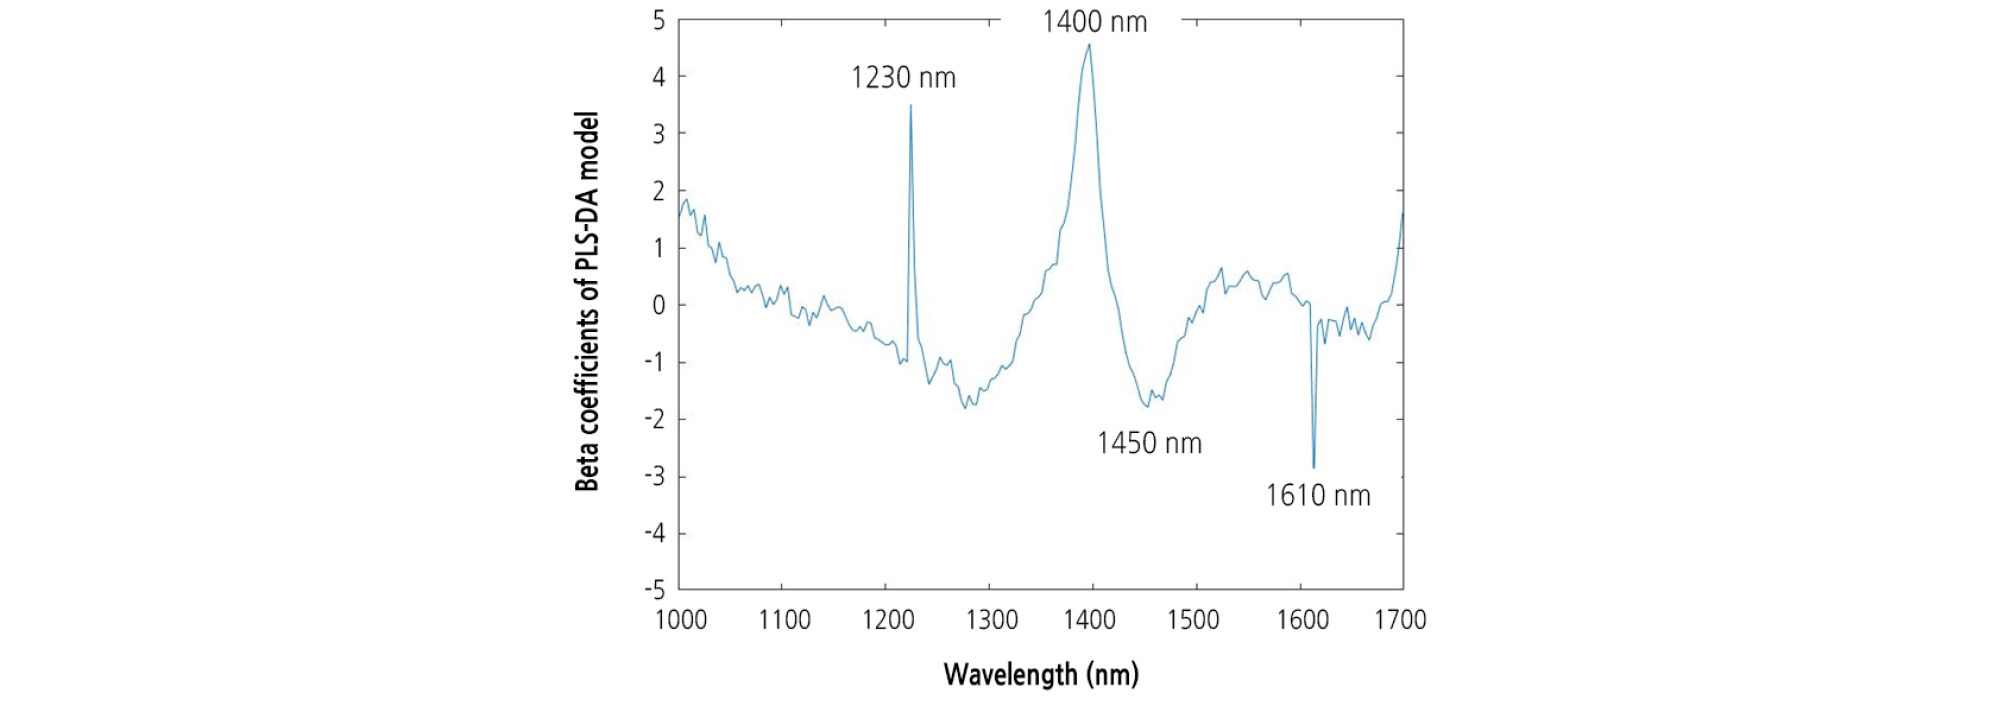
A beta coefficient plot was constructed for the PLS-DA model built for the entire 1,000 - 1,700 nm spectral region. The most informative wavelengths for the PLS-DA model were 1,230, 1,400, 1,450, and 1,610 nm (Fig. 8). The group values predicted using the optimal PLS-DA model and the actual group values for the watermelon seedlings are shown in Fig. 9. The group values were assigned 1 for healthy areas and 2 for diseased areas. A threshold of 1.5 was set between both groups to evaluate the classification performance. Samples within the range of 1.5 at any groups were considered as classified in that group. The PLS-DA plot showed distinct groupings of diseased and healthy leaves in the calibration and validation sets.

Visualization
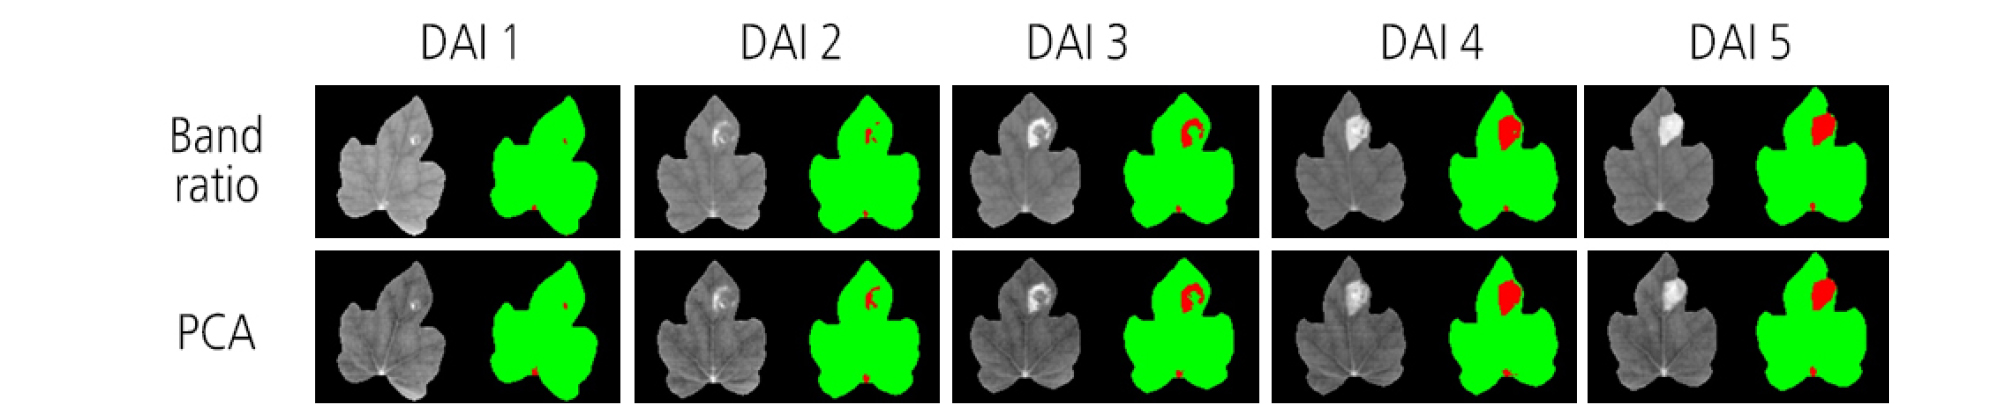
One of the advantages of HSI is that it presents a visualization map for a sample. Compared to traditional spectroscopy, each pixel in HSI data contains its own information. The map generated with the PLS-DA model provides information for determining the existence of BFB infection at each pixel of watermelon sample images. In this study, 50 hyperspectral images for the treatments of 1 × 10⁴ and 1 × 10⁶ cfu/mL concentrations were visualized by applying the PLS-DA model. Green color indicates a low value and red color a high value. The diseased areas were observed from 1 DAI in the visualization map for 1 × 10⁶ cfu/mL concentration (Fig. 10).
Discussion
Hyperspectral Reflectance of Watermelon Leaves Infected with BFB
In digital agriculture, monitoring plant health and detecting pathogens are essential for reducing the spread of diseases and for improving effective crop management strategies (Martinelli et al., 2015). Previous studies (Zhao et al., 2016; Mahlein et al., 2017) have been reported for detection, identification, and quantification of different plant diseases caused by viral, fungal, and bacterial infection.
BFB, which can cause serious damage to cucurbits, may be introduced into a field by contaminated seeds, infected transplants, or infected wild cucurbits. The first symptom in watermelon seedlings appears as a dark, water-soaking on the lower surface of cotyledons and leaves, followed by necrotic lesions, which may lead to chlorosis. In young seedlings, lesions can occur in the hypocotyl, resulting in collapse and death of the plant.
In this work, HSI was applied to detect BFB infection in watermelon seedlings. The HSI technique combines reflectance spectra with image processing. The mean spectra for the watermelon leaves infected with BFB were higher than those for the healthy samples in the NIR spectral range. Mean spectra for the samples increased with increasing DAI. This result depends on the spectral range of interests and a variety of plant diseases. The reflectance of cucumber green mottle mosaic virus-infected watermelon seeds was higher than that of healthy seeds in the wavelength of 950 to 1,100 nm (Lee et al., 2016). However, the reflectance of bacteria-infected seeds was higher than that of healthy seeds in the visible region (400 - 700 nm), whereas healthy seeds had a higher reflectance in the NIR region of 750 to 1,000 nm (Lee et al., 2017). For bacterial spot of tomato, the absorbance of diseased leaves was lower than that of healthy samples in the visible and NIR range (Jones et al., 2010). This suggests that the reflectance of diseased leaves is higher than that of healthy samples. The higher reflectance of bacteria-infected leaves in the NIR region may be caused by toxic byproducts associated with the growth of Acidovorax avenae subsp. citrulli (Lee et al., 2017).
Extraction of the Diseased Area
HSI acquisition generates considerable amounts of spectral data. Thus, extracting relevant information instead of using the original data is necessary (Sun et al., 2017). Two-band ratio and PCA were applied to extract the diseased area from each sample. Band ratio algorithms are frequently used to select the significant wavelengths for discrimination of infected area against healthy samples and to visualize the identification and distribution of resultant images (Yuan et al., 2014; Huang et al., 2016). Based on t values from the t-test between the two groups of healthy and infected areas, 1,588 and 1,450 nm wavelengths were selected as two significant bands. 1,588 and 1,450 nm wavelengths are known to be linked to strong absorption by the N-H stretching first overtone and the O-H functional group of water, respectively (Sevgi and Christian, 2017). Adjacent bands in the spectrum tend to be highly correlated. PCA was used to reduce the spectral dimensionality of hyperspectral reflectance images, and to determine effective wavelengths that are suitable for detecting blueberry fruit maturity (Yang et al., 2014), skin defects in bi-colored peaches (Li et al., 2016), and apple scab disease (Nouri et al., 2018). In the process of creating PC images, a covariance matrix of the images was calculated. This covariance matrix was then used to determine the eigenvalues that were equivalent to the variance of each PC image. These PC images were ordered in the descending order of variance magnitude, where the first PC explained most of the variance. The first three PC images (PC1, PC2, and PC3) were applied to the hyperspectral data as affected by DAI. A different PC image was used to extract diseased areas from binary images. The principal components explained the features of the HSI data properly. A quick visual inspection of the first three PC images revealed that diseased areas became more obvious in transformed images, demonstrating that PCA could extract useful features. PC images implemented to extract the disease symptoms were inconsistent according to the inoculation concentration and DAI. From these results, we realized that bacterial disease symptoms were observed even at 1 DAI by the application of two-band ratio or PCA. This implies that early detection of BFB symptom in watermelon leaves is possible if an appropriate method to discriminate between non-infected and infected areas is applied. In contrast, at least 3 - 4 days were required to detect disease symptoms in the watermelon leaves through digital images or non-preprocessed HSI.
Classification Accuracy and Visualization using PLS-DA Model
PLS-DA is a versatile algorithm that can be used for predictive and descriptive modeling as well as for discriminative variable selection (Lee et al., 2018). Much research has been performed to detect aflatoxin on corn kernels (Kandpal et al., 2015), decay lesions in citrus (Folch-Fortuny et al., 2016), and transgenic maize kernel (Feng et al., 2017) using PLS-DA models. In this work, HSI data extracted by two-band ratio and PCA was used for PLS-DA modeling to predict the infection accuracies of bacterial disease in watermelon leaves. Watermelon samples for PLS-DA modeling were randomly divided into calibration and validation sets consisting of 70% and 30%, respectively. Only the calibration data set was used to build the classification model, while the validation data set was used to test its capability in classifying new samples.
Using the hyperspectral data extracted by two-band ratio, the sensitivity obtained from the PLS-DA model was 0.95 for calibration and 0.93 for validation. For the model extracted by PCA, the sensitivity for calibration and validation were 0.87 and 0.83, respectively. The specificity values for two-band ratio were 1.00 for both calibration and validation sets. The specificity for PCA was 0.99 for calibration and 1.00 for validation. The model based on two-band ratio revealed better classification accuracies to distinguish BFB in watermelon leaves. The closer to 1 the sensitivity and specificity of a given class are, the better the classification performance of the model (López-Maestresalas et al., 2016). Similar classification results using HSI and PCA were reported in recent studies (Jiang et al., 2018; Sun et al., 2018). These results suggest that the combination of HSI techniques and PLS-DA allows us to accurately discriminate diseased from healthy areas in watermelon seedlings.
The most significant wavelengths selected by PLS-DA model were 1,230, 1,400, 1,450, and 1,610 nm. The 1,230 and 1,610 nm wavelengths could be attributable to the influence of CH stretching modes. The 1,400 and 1,450 nm wavelengths are associated with water absorptions bands due to the second and first overtones of OH stretching and OH combination bands (Sevgi and Christian, 2017). This may be associated with water loss from the tissue in and around the diseased area.
Image visualization helped to present the distribution of different features between the two groups of diseased and healthy leaves (Feng et al., 2017). HSI data treated with different inoculation concentrations were visualized by applying a PLS-DA model. Diseased areas were distinctly observed at 1 DAI in the visualization map for the 1 × 10⁶ cfu/mL concentration. However, a small spot in red was displayed around the point where the leaf vein meets the petiole. This outcome was judged to be a misclassification due to unexpectedly high reflectance. Thus, careful attention is required to minimize inaccurate classifications. Exact separation of the vein and the petiole from a leaf image may be helpful in this regard.
This study was conducted to detect BFB infection in watermelon seedlings using near-infrared HSI and to compare the discrimination accuracies using a PLS-DA model by two extraction methods, band ratio, and PCA. Our results suggest that near-infrared HSI has promising potential to detect disease symptoms in watermelon leaves infected with BFB. These results may stimulate the development of techniques to extend the discriminative analysis from the leaf level to the canopy level.
