

Introduction
Materials and Methods
Study Sites
Chlorophyll Fluorescence Test
Rapid Light Response Curves
Statistical Analysis
Results
Characteristics of Chlorophyll Fluorescence Parameters
Rapid light Response Curves Parameters
Elevation and Species Modifications of the Chlorophyll Parameters
Discussion
Introduction
Rhododendron L. is one of the largest woody plant genera and comprises at least 1,025 species globally. This genus is widely distributed from the northern temperate zone, throughout tropical Southeast Asia, to northeastern Australia (Chamberlain et al., 1996). Rhododendron species are major components of alpine and subalpine vegetation; they play critical roles in forest composition, functional processes, and ecosystem stability and are also famous as woody ornamental plants worldwide (Shen et al., 2015; Zhang et al., 2017). They thrive at different elevation gradients from the tropics to the alpine areas (Shrestha et al., 2017). Complex changes in environmental factors, such as light, temperature, nutrient, water availability, and UV-B radiation, occur over short distances associated with elevation, leading to distinct changes in the selection pressures imposed on plant adaptation (Vetaas and Grytnes, 2002; Kofidis et al., 2007; Wang et al., 2014; Gong et al., 2018). Thus, elevation gradients provide a unique and perfect “natural laboratory” to study the morphological and physiological responses of plants to environmental changes (Körner, 1999; Reinhardt et al., 2011; Villemereuil et al., 2018).
Chlorophyll fluorescence analysis is an effective approach in measuring photosystem II (PSII) activity and a commonly used technique in plant physiology. It is nondestructive and noninvasive and hence has a wide range of applications, such as rapid identification of injuries in leaves without visual symptoms and detailed analysis of causes of changes in photosynthetic capacity (Schreiber et al., 1995; Matysiak, 2004; Bhandari et al., 2018). Chlorophyll fluorescence analysis is a useful tool in understanding the fundamental mechanisms of photosynthesis, responses of plants to environmental change, genetic variation, and ecological diversity (Rascher et al., 2000; Murchie and Lawson, 2013; Pollastrini et al., 2017; Sancho-Knapik et al., 2018). PSII photochemical activity plays a significant role in the photosynthetic response to external environmental factors, such as temperature, water availability, and UV-B radiation; it has been widely studied using chlorophyll fluorescence analysis (Fracheboud et al., 1999; Kalaji et al., 2016). The acclimatization or adaptation ability of species has also been proposed. For example, Osório et al. (2010) investigated the acclimation of the micropropagated plants of Rhododendron ponticum subsp. baeticum to different irradiances and their recovery after exposure to high irradiance using chlorophyll fluorescence analysis. Matysiak (2004) assessed the effect of light intensity on the growth and physiological responses of Rhododendron microcuttings during acclimatization. Zhou et al. (2017) studied the physiological adaptation mechanism of R. agastum in response to shading through chlorophyll fluorescence measurements.
Although chlorophyll fluorescence analysis is a useful tool in assessing the acclimatization and adaptation of plants in changing environments (Harris et al., 2006), it is rarely used to study the photochemical properties of trees in forests under multiple environmental factor changes, especially at the interspecific levels in the field. Thus, this study was designed to explore the responses of the Rhododendron species to different elevations and associated multiple environmental changes in the field. The chlorophyll fluorescence parameters and rapid light response curves of eight Rhododendron species at five elevation gradients were measured and analyzed, and their relationship with elevation was also discussed. We hypothesized that Rhododendron species would exhibit variations in photosynthetic activities related to species-specific adaptation in an alpine environment at different elevations. Specifically, the aims of this study were (1) to assess the photosynthetic adaptability of Rhododendron species at different elevations by examining the species’ chlorophyll fluorescence parameters and rapid light response curves and (2) to determine the effect of elevation on the photosynthetic adaptability of Rhododendron species.
Materials and Methods
Study Sites
The Jiaozi Mountain National Nature Reserve (102°48'-102°58' E, 26°00'-26°10' N) is a natural habitat located in northern Kunming, Yunnan Province, southwestern China. This site has a distinct plateau monsoon climate, and the elevation ranges from 2,300 to 4,300 m. The annual rainfall is ~1800 mm, and the annual average temperature is 2- to 6°C. Based on a previous survey, the main vegetation of this forest is broad-leaved trees, in particular alpine Rhododendron and Sabina squamata species. A great variety of Rhododendron species (~20) were also found in the same nature reserve. Five elevation gradients (at elevations of 2,950, 3,560, 3,660, 3,770, and 4,030 m) were selected as the experimental sample plots. Different Rhododendron species were collected as the test materials from the five sample plots. GPS was used to record the latitude and longitude of each sample plot. The five different elevational plots and sampled Rhododendron species are shown in Table 1.
Table 1. Details of sample plots and species along different elevation gradients in this study
Chlorophyll Fluorescence Test
The Rhododendron leaves were collected from the same cardinal points in June 2017. After sampling, the branches were immediately placed in hermetic plastic bags. The branches in the plastic bags were humidified to avoid leaf dehydration until they reached the laboratory on the same day (Pollastrini et al., 2017). Nine mature leaves from three individual plants (three branches were selected from each plant, and one leaf was selected from each branch) for each species were harvested for the analysis of the chlorophyll fluorescence parameters and chlorophyll relative content (SPAD: leaf chlorophyll content index). Average values were calculated. The SPAD of the leaves was measured using the SPAD-502Plus meter (Konica Minolta, Tokyo, Japan).
To prepare for the analysis, the leaves were dark adapted for at least 20 min. The chlorophyll fluorescence parameters were measured using a portable fluorometer (MINI-PAM, Walz, Effeltrich, Germany) at ambient temperature (18 - 25°C). The maximum photochemical efficiency of PSII was estimated using the variable to maximum fluorescence ratio (Fv/Fm = (Fm-F0)/Fm) calculated from the basal fluorescence (F0) and maximum fluorescence (Fm), with variable fluorescence (Fv) = Fm-F0. The leaves were irradiated with actinic radiation (333 µmol·m-2·s-1) until stable photosynthesis occurred. The steady-state fluorescence (Fs) was recorded; subsequently, a saturating flash was imposed to determine the maximum level in the light-adapted state (Fm'). The actinic light was removed, and the leaves were irradiated with far-red light to obtain F0 adapted to light (F0'). The nonphotochemical quenching (qN), photochemical quenching (qP), electron transport rate (ETR), and actual photochemical efficiency of PSII (ΦPSII) were calculated as 1−(Fm'−F0')/(Fm−F0), 1−(Fs−F0')/(Fm'−F0'), ΦPSII × PAR (photosynthetic active radiation) × 0.84 × 0.5, and (Fm'−Fs)/Fm', respectively (Osório et al., 2010).
Rapid Light Response Curves
The rapid light response curves were measured using a MINI-PAM fluorometer (Walz, Effeltrich, Germany). The actinic illumination was applied in eight steps (134, 229, 333, 453, 663, 895, 1,340, and 1,964 µmol·m-2·s-1); each step lasted for 10 s. The parameters, namely, the maximum electron transport rate (ETRmax), light saturation coefficient (Ek), and linear initial slope (α), were obtained using the rapid light response curve fitting formula: ETR = ETRmax* (1-e-α*PAR/ETR) *e-β*PAR/ETRmax, Ek = ETRmax/α (Platt et al., 1980).
Statistical Analysis
The influence of the elevation and species on the chlorophyll fluorescence and leaf chlorophyll content was analyzed with general linear models (GLMs) using R and sequential (type I) sums of squares (Schmid et al., 2002). The elevations and species were regarded as fixed factors. The variance was related to the main treatments and the interaction between them. For post hoc analysis, Tukey’s multiple comparison test was used (p < 0.05).The relationships between chlorophyll fluorescence and elevations and between the rapid light response curves and elevations were determined using Pearson’s correlation analysis. All statistical analyses were performed using SPSS version 13.0 software (SPSS Inc., Chicago, IL, USA).
Results
Characteristics of Chlorophyll Fluorescence Parameters
The average values of the chlorophyll fluorescence parameters of the Rhododendron species across the five elevation gradients in Jiaozi Mountain are shown in Fig. 1. The Fv/Fm ranged from 0.78 to 0.81 at the five elevation gradients. The ΦPSII ranged from 0.51 to 0.60; the lowest and highest values were recorded at elevations of 2,950 and 3,560 m, respectively (Table 2). Significant differences in Fv/Fm and ΦPSII at the five elevation gradients were detected (p < 0.05). No significant difference in Fm or slight difference in F0 at the five elevations was noted, whereas a significant difference in Fs at the five elevations was observed. The qP and qN values ranged from 0.59 to 0.83 and from 0.35 to 0.58, respectively. The elevation significantly affected both qP and qN (Table 3). The lowest qP was detected at 4,030 m, whereas the highest qN occurred at 2,950 m. The lowest ETR was detected at 2,950 m. However, the ETR values decreased when the elevation increased from 3,560 to 4,030 m. In general, the SPAD increased as the elevation increased and reached the highest value of 63.35 at 4,030 m (Table 2).
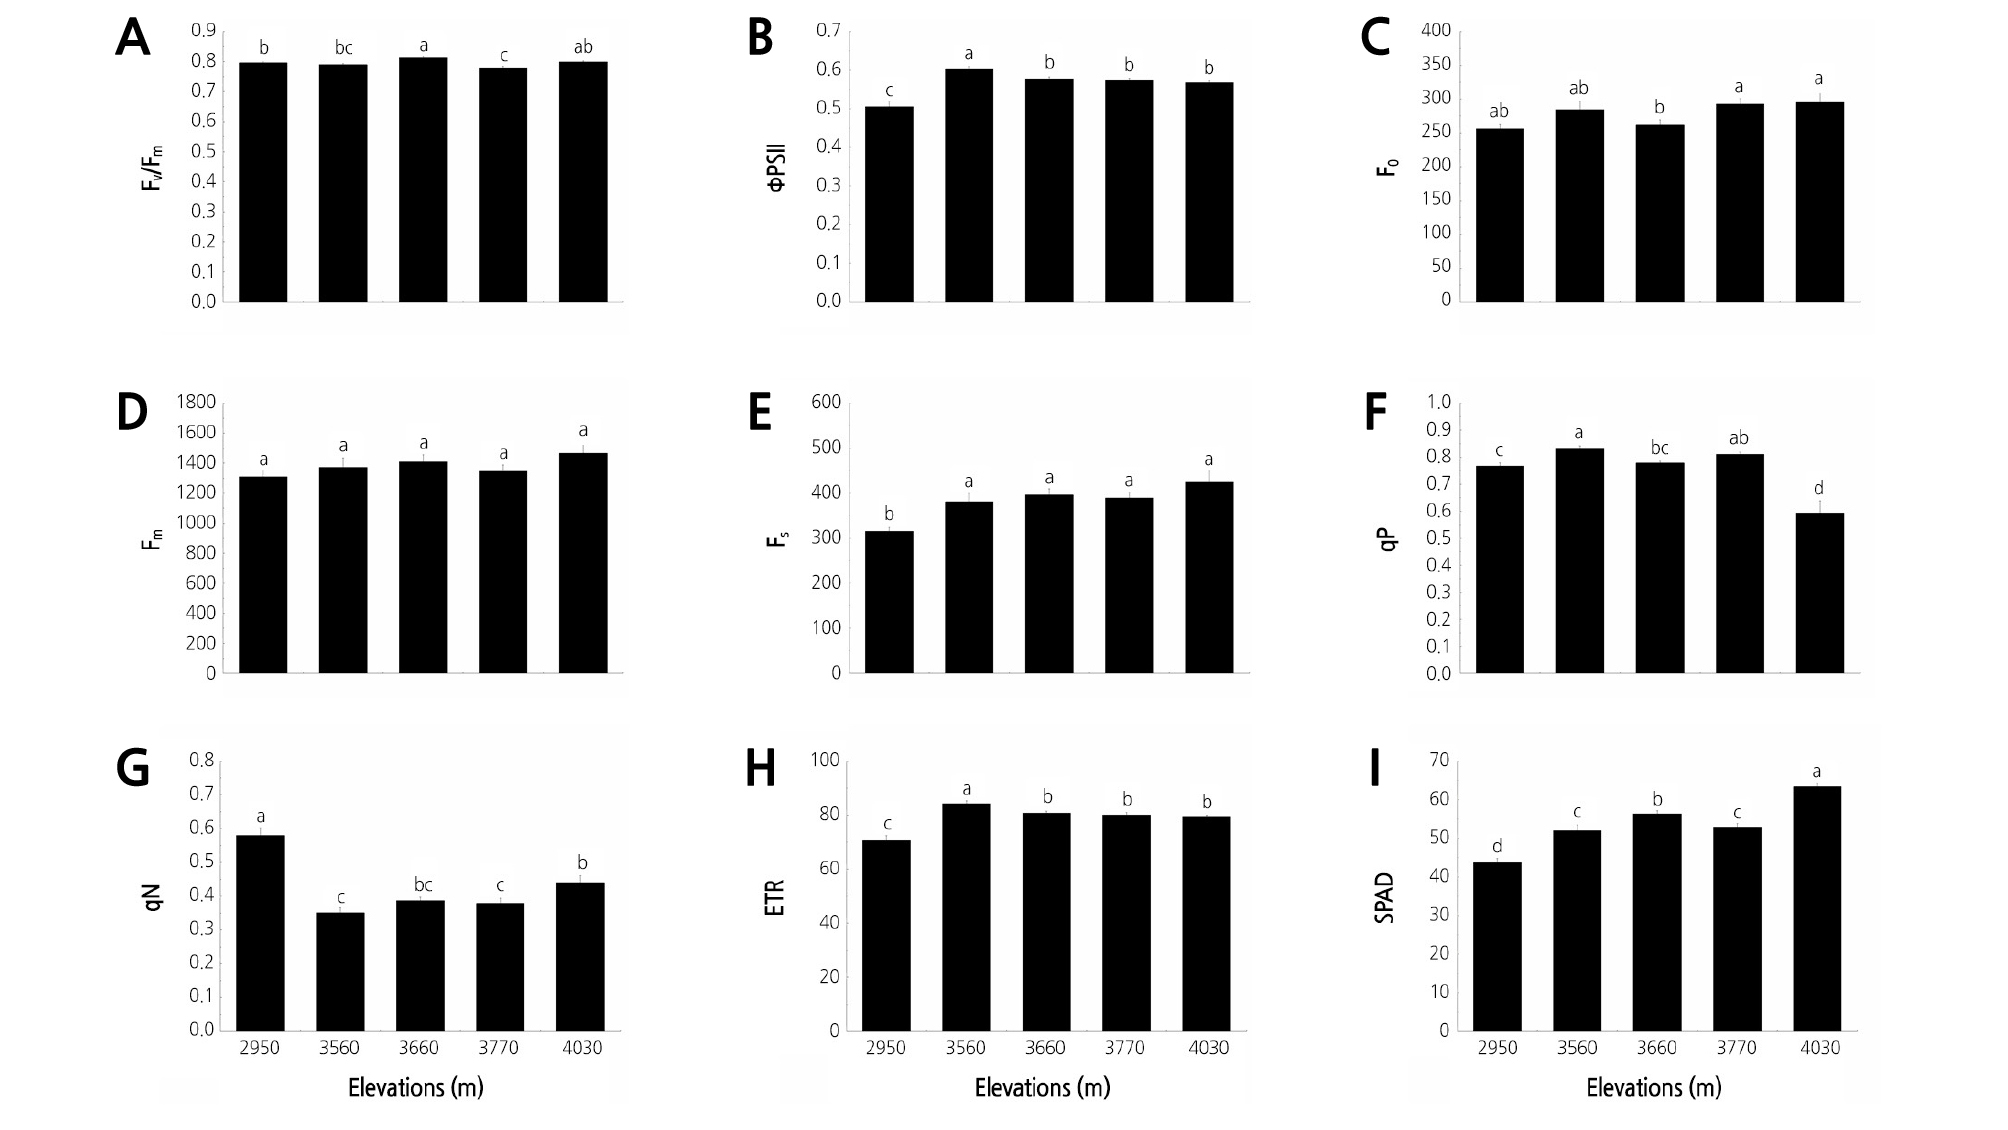
Fig. 1.
Characteristics of chlorophyll fluorescence parameters of Rhododendron species at five elevation gradients on Jiaozi Mountain. (A) Variable to maximum fluorescence ratio (Fv/Fm), (B) Actual photochemical efficiency of PSII (ΦPSII), (C) Basal fluorescence (F0), (D) Maximum fluorescence (Fm), (E) The steady-state fluorescence (Fs), (F) The photochemical quenching (qP), (G) The nonphotochemical quenching (qN), (H) The electron transport rate (ETR), (I) The chlorophyll relative content (SPAD). Different letters indicate statistically significant differences at p ≤ 0.05.
Table 2 Characteristics of chlorophyll fluorescence (Chl) and rapid light response curve (RLC) parameters of Rhododendron species at each elevation
Table 3. Summary of GLMs for the effect of elevations, species, and their interactions on chlorophyll fluorescence (Chl) and rapid light response curve (RLC) parameters
Rapid light Response Curves Parameters
Fig. 2 shows the rapid light response curve parameters of the Rhododendron species at the five elevation gradients in Jiaozi Mountain. The elevations significantly affected the rapid light response curve parameters of the Rhododendron species (Fig. 2 and Table 3). The ETRmax and Ek exhibited a similar change tendency; that is, the highest and lowest values occurred at 3,770 and 2,950 m, respectively. The α ranged from 0.31 to 0.36 and decreased with increasing elevation.
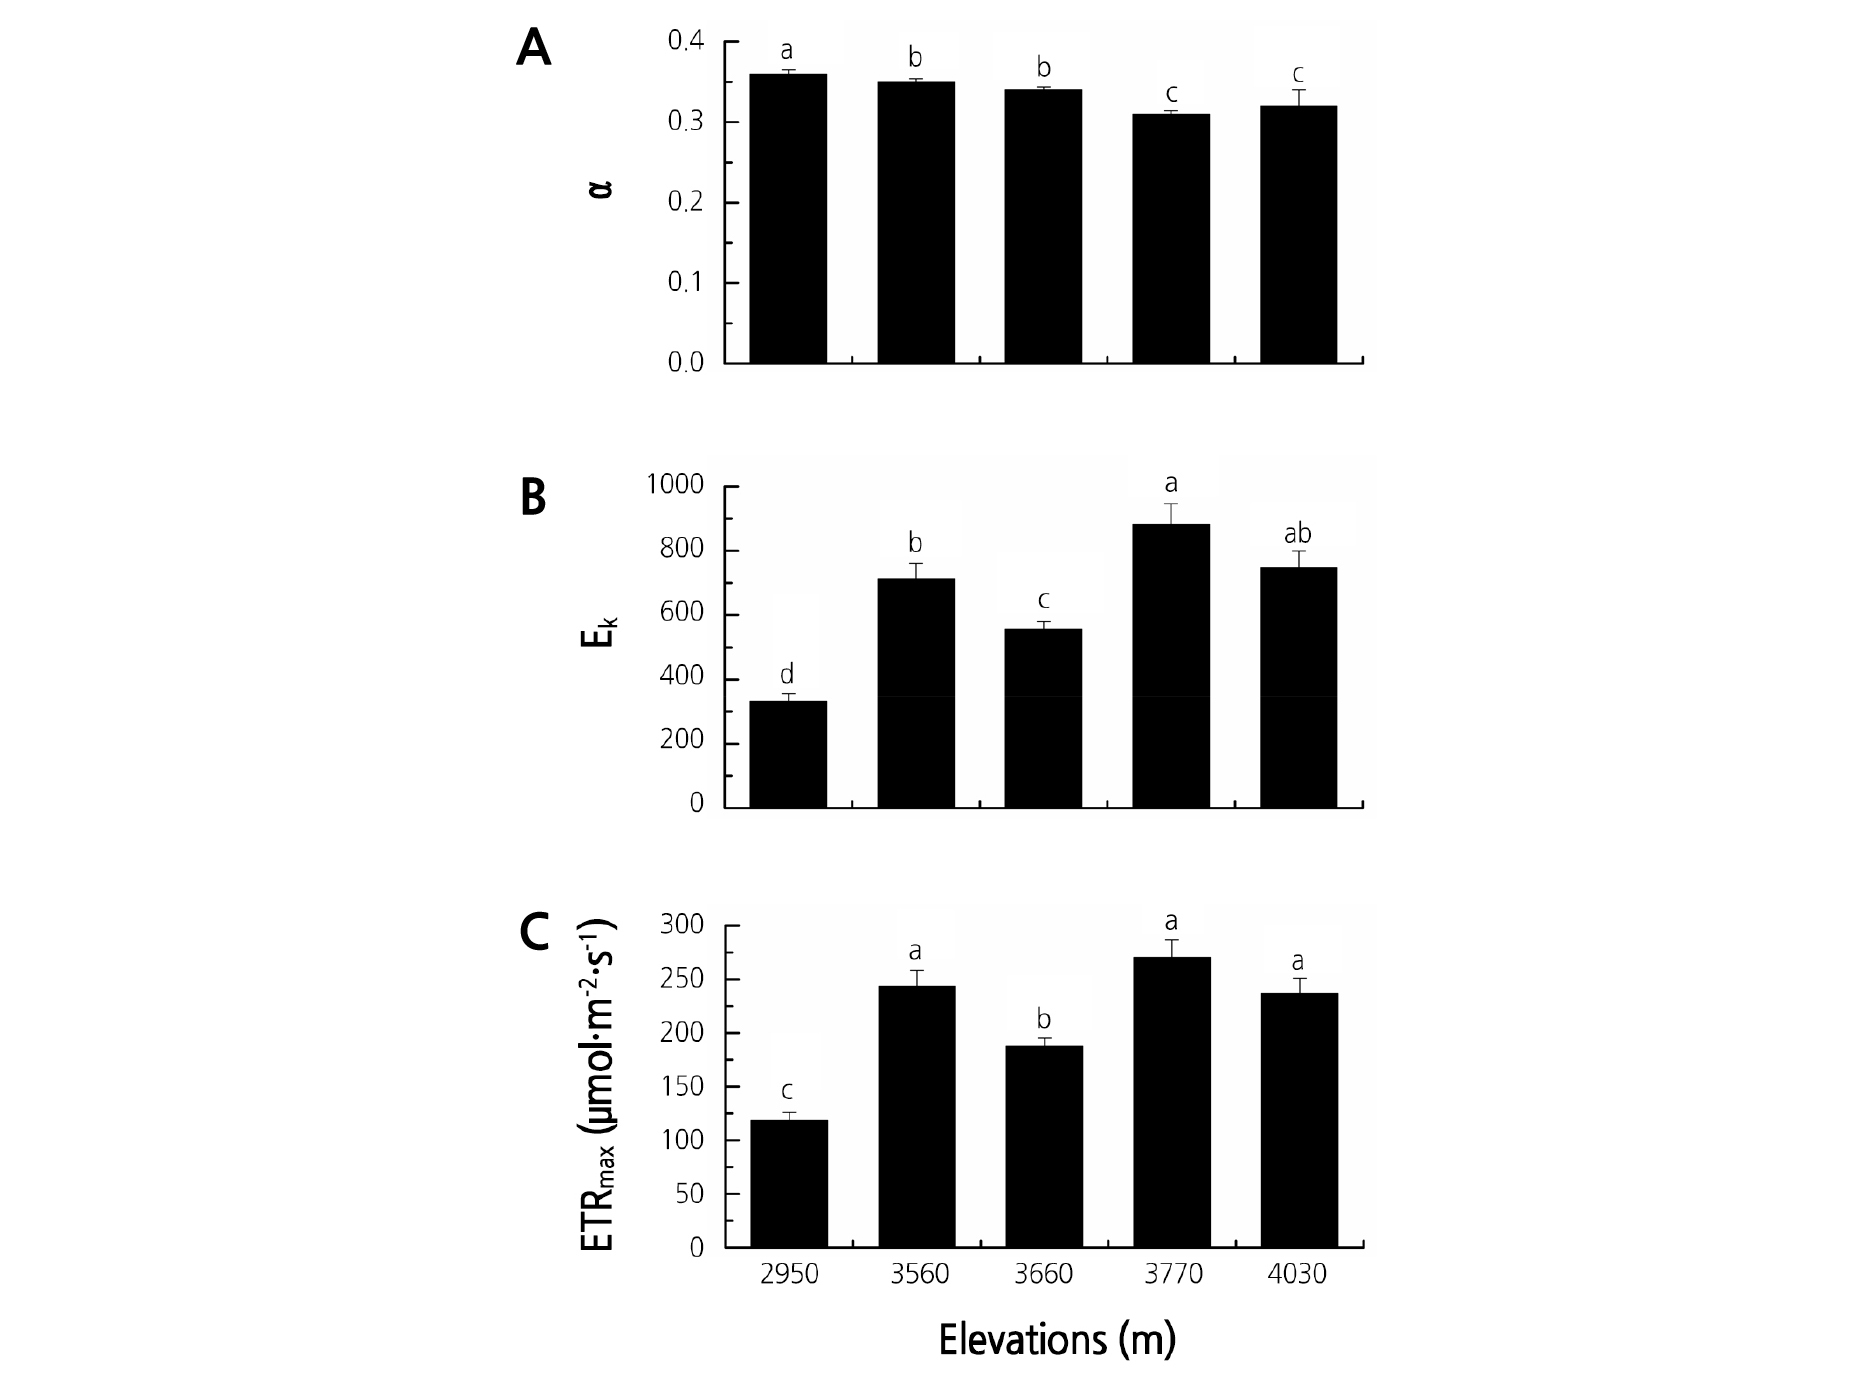
Fig. 2.
Rapid light response curve parameters of the Rhododendron species at the five elevation gradients on Jiaozi Mountain. A: linear initial slope (α), B: light saturation coefficient (Ek), C: the maximum electron transport rate (ETRmax). Different letters indicate statistically significant differences at p ≤ 0.05.
Elevation and Species Modifications of the Chlorophyll Parameters
The GLM analysis showed that the effect of the elevations and the interaction of the elevation and species were significant for all the chlorophyll fluorescence and rapid light response curve parameters, except for the effect of the elevations on F0 and Fm. Species also exerted a significant effect on the chlorophyll fluorescence parameters, except for Fv/Fm and F0. However, species exerted no significant effect on ETRmax and Ek (Table 3). The correlation analysis also indicated that the elevation was significantly correlated with most of the chlorophyll fluorescence and rapid light response curve parameters (Fv/Fm, Fs, ΦPSII, ETR, ETRmax, Ek, and SPAD), except for Fm and F0. Elevation was negatively significantly correlated with qP, qN, and α.
Discussion
Alpine ecosystems are “fragile” due to carbon limitation and therefore are highly susceptible to environmental changes (Körner, 1999; Sherman et al., 2008). Alpine plants are subjected to relatively low temperature, high irradiance, and strong drought conditions associated with high elevations (Streb et al., 1998;Benito et al., 2011; Perera-Castro et al., 2017). Chlorophyll fluorescence provides insights into the mechanisms of tolerance to environmental stresses and information on the contribution of the interspecific differences in response to environmental heterogeneity to the mechanisms of species coexistence and maintenance of biodiversity (Ball et al., 1995; Körner, 1999; Maxwell and Johnson, 2000). Thus, this study on the chlorophyll fluorescence variations across different elevations elucidates how species adapt to environmental changes.
The Fv/Fm ratio is one of the most important fluorescence parameters that reflect the maximum quantum efficiency of PSII photochemistry (Hwang and Choo, 2016; Sancho-Knapik et al., 2018). The Fv/Fm of dark-adapted leaves is an indicator of the potential photochemical efficiency of PSII and quantum yield (Harris et al., 2006; Kalaji et al., 2016). Healthy photosynthetic tissues of most plant species exhibit a mean Fv/Fm of 0.75 to 0.85 (Bjorkman and Demmig, 1987). In this study, the Fv/Fm ranged from 0.79 to 0.81. This finding indicated that studied species were well grown and adapted to the current environmental conditions. However, the apparent difference in Fv/Fm both at elevation gradients and elevation × species levels indicated that the Rhododendron species exhibited species-specific adaptation to the environment at different elevations.
The light energy absorbed by the chlorophyll molecules in leaves drives photosynthesis (qP), is dissipated as heat (qN), or is re-emitted as chlorophyll fluorescence (Maxwell and Johnson, 2000; Fu et al., 2012). Hence, the changes in qP and qN reflect the intensity of photosynthesis to some extent. In this study, the Rhododendron species exhibited relatively higher ΦPSII and qP and lower qN at 3560 m than at other elevations. Thus, the Rhododendron species at 3,560 m exhibited stronger adaptability than those at other elevations on Jiaozi Mountain. The species also demonstrated adaptive strategies to the different environments. For instance, the species showed increased qN and decreased ETR at 2,950 m and distinctly increased SPAD at 4,030 m to adapt to the corresponding elevations.
Rapid light response curves provide detailed information on the saturation characteristics of electron transport and the overall photosynthetic performance of a plant (White and Critchley, 1999; Ralph and Gademann, 2005; Serôdio et al., 2013). The elevation effect is a proxy for environmental factors, including CO2 pressure, air temperature, solar irradiance, precipitation, and wind exposure. Each of these factors across the elevation gradient can significantly affect the physiological adaptation of species (Körner, 1999; Wang et al., 2014). Alpine species across elevation gradients need to adapt to the different levels of irradiance and temperature under natural conditions. In some alpine plants, photosynthesis is highly efficient at cool temperatures; they are also adapted to high irradiance (Streb et al., 1998; Körner, 1999). Osório et al. (2010) found that R. ponticum subsp. baeticum exhibits high ETRmax and Ek when grown under high irradiance during species acclimation. In this study, significant positive relationships between the ETRmax and Ek and the elevations were observed. This finding indicated that the Rhododendron species could increase their ETRmax and Ek and could decrease their α as adaptive responses to adverse environmental conditions related to high elevations.
Analysis of the selected chlorophyll parameters and rapid light response curves may be useful for studying the photosynthetic responses and physiological adaptation variations of alpine Rhododendron species to environmental changes across elevation gradients. In summary, this study provided evidence that Rhododendron species exhibit species-specific adaptation to environmental changes at different elevations. Future research should aim to elucidate the precise mechanism of the responses of Rhododendron species to natural environmental changes.
