

Introduction
Materials and Methods
Plant Materials
Irrigation Regimes
Measurements
Results
Soil Water Potential (Ѱsoil) and Evapotranspiration
Leaf Water Potential
Leaf Gas Exchange and Water-Use Efficiency (WUE)
Vegetative Growth and Dry Matter
Discussion
Leaf Water Potential (Ѱleaf) and Evapotranspiration
Photosynthesis and Related Parameters
Vegetative Growth and Dry Matter
Introduction
The provision of adequate irrigation according to the growth stage of fruit trees is critical for obtaining quality fruit. Water stress, especially during the early stage of growth, affects the cell division of shoots and fruit, so the failure to provide proper irrigation to fruit trees during the early growing season can negatively affect productivity, as well as vegetative growth (Cui et al., 2009; Girona et al., 2010; Beyá-Marshall et al., 2018). Severe spring droughts, which have become a prevalent phenomenon in Korea, are hindering the proper response to periodic irrigation and causing depletion of water resources for irrigation in the early stage of apple (Malus domestica) tree growth. Moreover, the frequency and intensity of drought in spring, due to climate change, is not easily predictable. Thus, drought-tolerant apple rootstocks (Li et al., 2002) may have advantages for fruit production, even in areas with insufficient irrigation water or low precipitation.
Plants adapt to soil water deficit in several ways during the dry period. A well-developed, deep-penetrating root system is one of the effective strategies for plants to withstand drought (Comas et al., 2013). If the water available to the plant is restricted, the root:shoot ratio in the dry matter partitioning increases, reducing the demand for transpiration per unit root length because roots are less sensitive to growth inhibition compared with shoots (Wu and Cosgrove, 2000). Apple trees are relatively drought tolerant, but stomatal closure occurs when the leaf water potential falls below ‑ 2.0 MPa (Atkinson et al., 2000). Although the closing of the stomata can prevent water loss by transpiration, it also decreases the rate of photosynthesis, which, in turn, reduces the production of dry matter, such as leaves, shoots, and roots (Fernandez et al., 1997; Šircelj et al., 2007).
Despite an incomplete understanding of the mechanisms that confer drought tolerance to rootstocks, the capacity of rootstocks for drought tolerance may alter the behavior of grafted scions (Bauerle et al., 2011; Serra et al., 2014). The contribution of rootstocks to water stress tolerance depends on several factors, one of which is vigor (Corso and Bonghi, 2014). Vigorous rootstocks increase the allocation of assimilates to the roots, which increases the surface of the root system that can come into contact with the soil, thereby increasing the ability to explore for moisture (Bauerle et al., 2011). According to Psarras and Merwin (2000), the root:shoot ratio contributed more decisively to the drought tolerance of the apple trees relative to rootstock vigor.
Specific elite Cornell-Geneva apple rootstocks show high resistance to fire blight, good tolerance to apple replant disease, and outperform M26, M9, and other existing standard rootstocks not only for productivity but also for cold temperature tolerance (Robinson et al., 2006; Auvil et al., 2011). The purpose of this study was to assess the drought tolerance of 1-year-old ‘Fuji’ apple trees grafted on several promising Cornell-Geneva rootstocks and the most common dwarfing rootstocks, M26 and M9, in terms of vegetative growth and physiology.
Materials and Methods
Plant Materials
This study was carried out in a non-heated greenhouse with automatic ventilation and shading control in the experimental fields of Kyungpook National University, Gun-Wi, Korea (36°06'48.3"N, 128°38'35.8"E). Six types of the apple (Malus domestica) G and CG rootstock series from Cornell University, and the apple rootstocks M26 and M9, which are widely used in Korea, were investigated. The ‘Fuji’ variety was grafted as a scion onto 1-year-old G11, G202, G214, G935, CG4814, CG5087, M26, and M9 rootstocks. On March 5, 2017, the grafted trees were planted in 17-L pots (one tree per pot) filled with a soil mix of sand:horticultural growing media (72% coco peat, 8.5% peat moss, 6% vermiculite, 9.5% perlite):compost at a ratio of 5:3:2 (v/v/v). From 2 months after planting to the end of the experiment, the entire pot was wrapped in black, non-woven fabric to prevent excessive temperature increases in the rhizosphere and to retain soil moisture.
Irrigation Regimes
Water was sufficiently supplied to all grafted trees once or twice daily until treatment initiation, depending on the growing season and meteorological conditions, by drip irrigation with pressure compensating nozzles. The water management regime was changed after June 23, on the 111th day after planting. In the drought stress (DS) treatment, the water supply was ceased completely from June 24 until July 5, when the soil water potential (Ѱsoil) fell below ‑ 695 hPa, followed by re-irrigation for 1 week. The second DS treatment was then induced by stopping irrigation again for 17 days from July 12 to July 28. Afterward, DS was discontinued, and from July 29 to August 8, trees under DS were irrigated in the same way as those under the control (CT) treatment. Meanwhile, trees under the well-irrigated CT condition were subjected to sufficient irrigation (2.0 L per day) throughout the experiment.
The experimental design comprised a randomized block for each of five blocks (CT vs. DS), and there was a single tree of the same rootstock in one of the blocks. Foliar fertilization was applied as 0.3% urea on May 2, and each pot was fertilized with 20 g of compound fertilizer (N:P:K = 21:17:17) on May 13.
Measurements
During the experiment, Ѱsoil was measured using a hand-made tensiometer that allowed automatic data recording (Thalheimer, 2013), and the moisture level in the soil was recorded every 3 h during the treatment. The leaf water status was measured using a pressure chamber (Model 3005, Soil Moisture Equipment Corp., Goleta, CA, USA) three times; before the DS initiation (June 23), on the 17th day after re-irrigation of DS trees (July 28), and on the 11th day after the cessation of DS (August 8). The predawn leaf water potential (Ѱpd) was measured in one leaf per replication between 04:00 and 06:00 h, and the midday leaf water potential (Ѱmd) was measured in the same way and on the same day between 12:00 and 14:00 h. These leaves used for Ѱleaf measurement were reflected in the leaf area and leaf dry weight data.
The amount of evapotranspiration per day per tree between July 5 and July 11 was measured using a digital SVI-50C weighing scale (Acculab, Edgewood, NY, USA). The measurements were made twice daily at 05:00 and 20:00 h by weighing each pot, and the weight difference was estimated as the amount of evapotranspiration per day.
Net photosynthetic rate (Pn), stomatal conductance (Gs), and transpiration rate (E) were measured between 11:00 and 15:00 h at approximately 1-week intervals during the treatment using a portable gas exchange system (LCI Portable Photosynthesis System, ADC BioScientific Ltd., Hoddesdon, UK) on 1 ‑ 2 mature leaves per replication. The photosynthetic photon flux density was fixed at 1,500 µmol·m-2·s-1 with a halogen lamp for photosynthesis measurements. Water-use efficiency (WUE) was calculated as Pn / E.
Tree height was recorded at approximately 1-week intervals from June 16 to the end of the experiment. The scion diameter was measured twice using a digital Vernier caliper (CD-20CPX, Mitutoyo, Kawasaki, Japan) in the lattice direction, 5 cm above the graft union, after which the trunk cross-sectional area (TCA) was obtained. The relative growth rate (RGR) of ‘Fuji’ trees subjected to DS was calculated by dividing the weekly tree vertical growth under DS by the weekly tree vertical growth under the CT condition. On August 9, at the end of the 11-day recovery period, the area of each leaf attached to the tree was determined using a portable leaf area meter (LI-3000, with conveyor belt assembly, Li-Cor, Inc., Lincoln, NE, USA) before investigating various parts of the plants using destructive methods. Afterward, all trees (both DS and CT) were separated into shoot, leaf, coarse root (>2 mm diameter), and fine root (<2 mm diameter) categories. Samples were then dried at 72°C for 72 h to obtain the dry weight of each sample.
Data were analyzed by one- or two-way analysis of variance (ANOVA) using SAS 9.4 software (SAS Institute, Inc., Cary, NC, USA). Significant differences among the rootstocks were evaluated by Duncan’s multiple range test at p < 0.05.
Results
Soil Water Potential (Ѱsoil) and Evapotranspiration
During the treatment, the Ѱsoil of the CT trees was generally maintained at ‑ 30 to ‑ 55 hPa (Fig. 1). When the Ѱsoil under DS fell below about ‑ 700 hPa, the tensiometer’s measurement range was exceeded, so the water in the tensiometer tube was replenished again. Re-irrigation was performed for 1 week from July 5, when the Ѱsoil fell below ‑ 695 hPa in the DS treatment. Then, stress resumed from July 12 to July 28. From July 29 to August 8, at the end of the experiment, DS maintained the Ѱsoil between ‑ 30 and ‑ 47 hPa.
In the CT condition, the evapotranspiration volume was generally higher in the G202, G935, and M26 trees, and lower in the CG4814 tree relative to the other trees during the re-irrigation, although slight differences were found depending on the date (Fig. 2). In the DS treatment, there was no noticeable difference between rootstock types during re-irrigation, despite lower evapotranspiration in the G935 tree (388, 351, and 200 g) than in the other trees (ranges: 431 ‑ 462, 366 ‑ 396, and 218 ‑ 232 g) on July 5, 6, and 8, respectively.
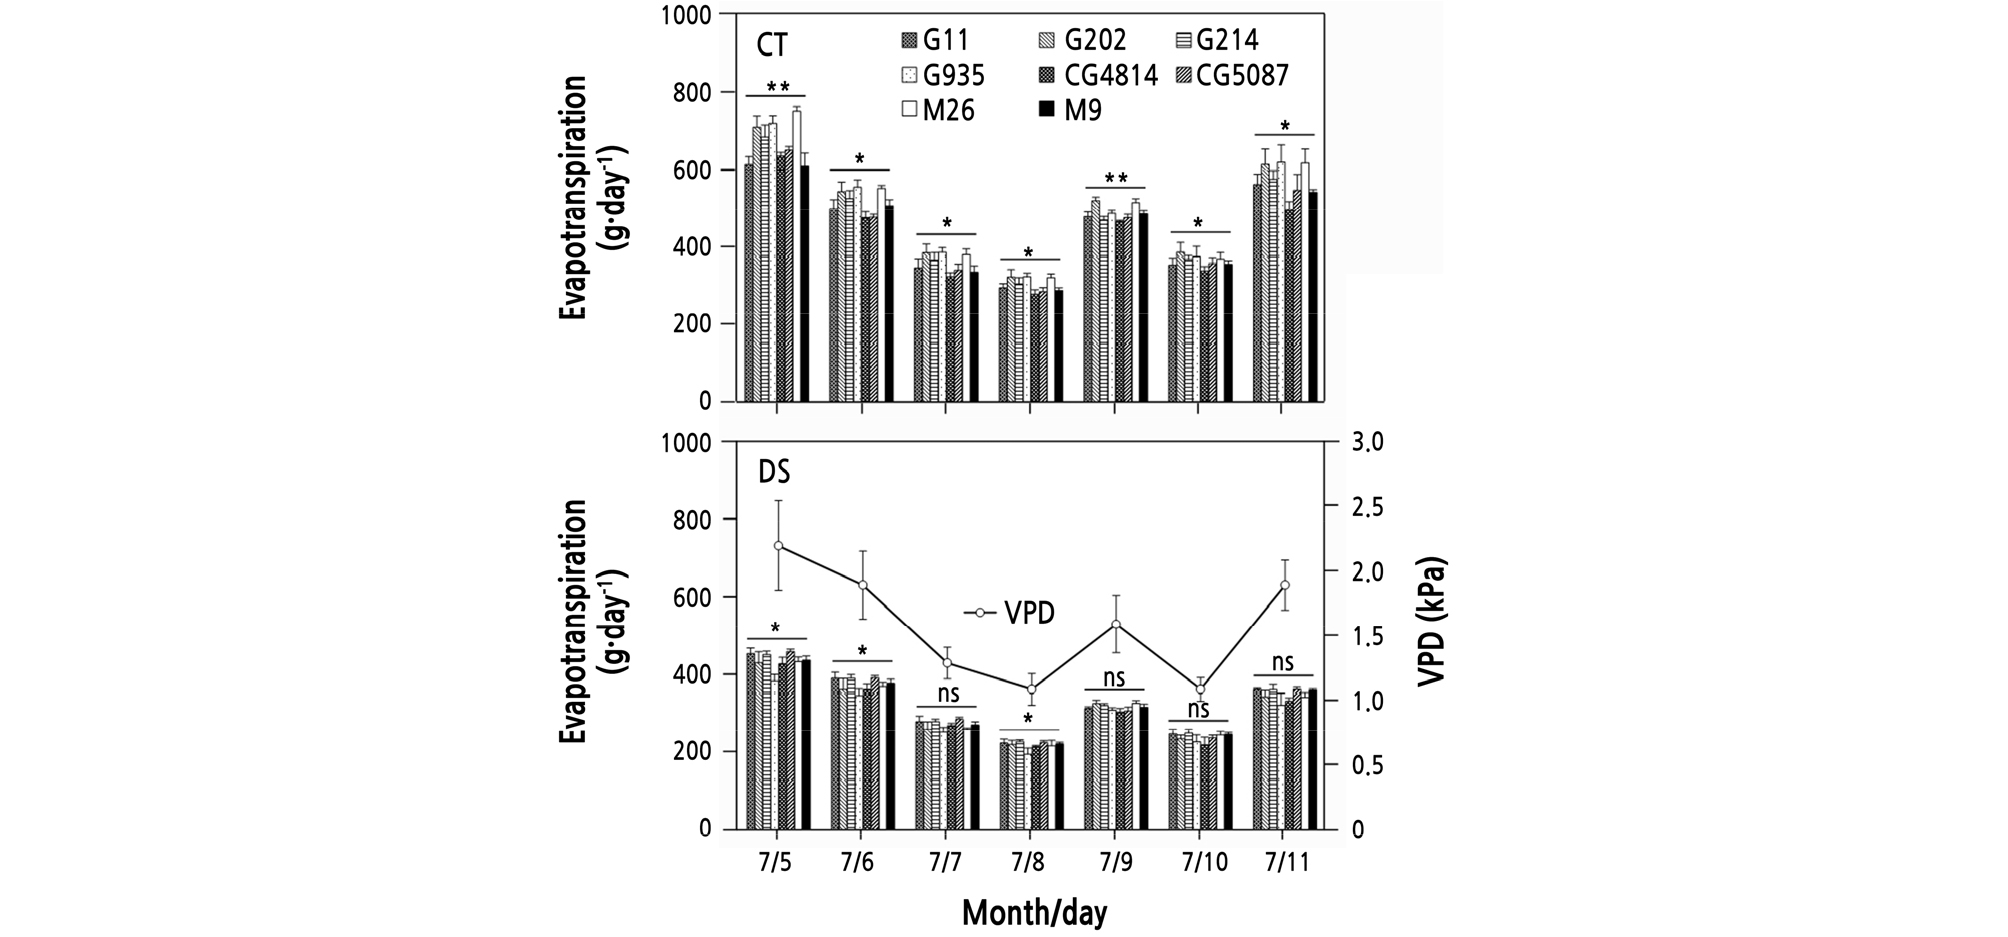
Fig. 2.
Changes in evapotranspiration in ‘Fuji’ tree pots for 1 week during re-irrigation in the control (CT) and drought stress (DS) treatments. Vapor pressure deficit (VPD) between 05:00 and 20:00 h on the day indicated. Vertical bars represent the mean ± standard error. * and ** significant at p < 0.05 and 0.01, respectively, ns: not significant.
Leaf Water Potential
On June 23, before initiation of DS, the Ѱpd of 1-year-old ‘Fuji’ apple trees was ‑ 0.26 to ‑ 0.34 MPa in CT and DS conditions, regardless of the rootstock types, and the Ѱmd was ‑ 1.25 to ‑ 1.55 MPa (Fig. 3). On July 27, the Ѱpd was ‑ 0.30 to ‑ 0.40 MPa in the CT. In the DS treatment, all trees were in severe water deficit status throughout the day, with Ѱpd of ‑ 2.95 MPa for G214 and ‑ 3.90 MPa for M26. The Ѱmd range of the CT trees was ‑ 1.35 to ‑ 1.75 MPa, but in the DS treatment, the Ѱmd for G214 was ‑ 3.08 MPa, and for M26 the Ѱmd decreased to ‑ 4.01 MPa. On August 8, the 11th day since irrigation of the DS treatment was resumed in the same manner as in the CT, the Ѱpd of the DS trees was ‑ 0.55 MPa for M9 and ‑ 0.80 MPa for M26, which was still lower than ‑ 0.31 to ‑ 0.38 MPa in the CT. The Ѱmd range was ‑ 1.64 to ‑ 1.85 MPa in the CT. In the DS treatment, the Ѱmd was ‑ 2.42 MPa for G11 and ‑ 3.01 MPa for M26 and CG4814, indicating a slight recovery tendency, but it was still markedly lower than in the CT.
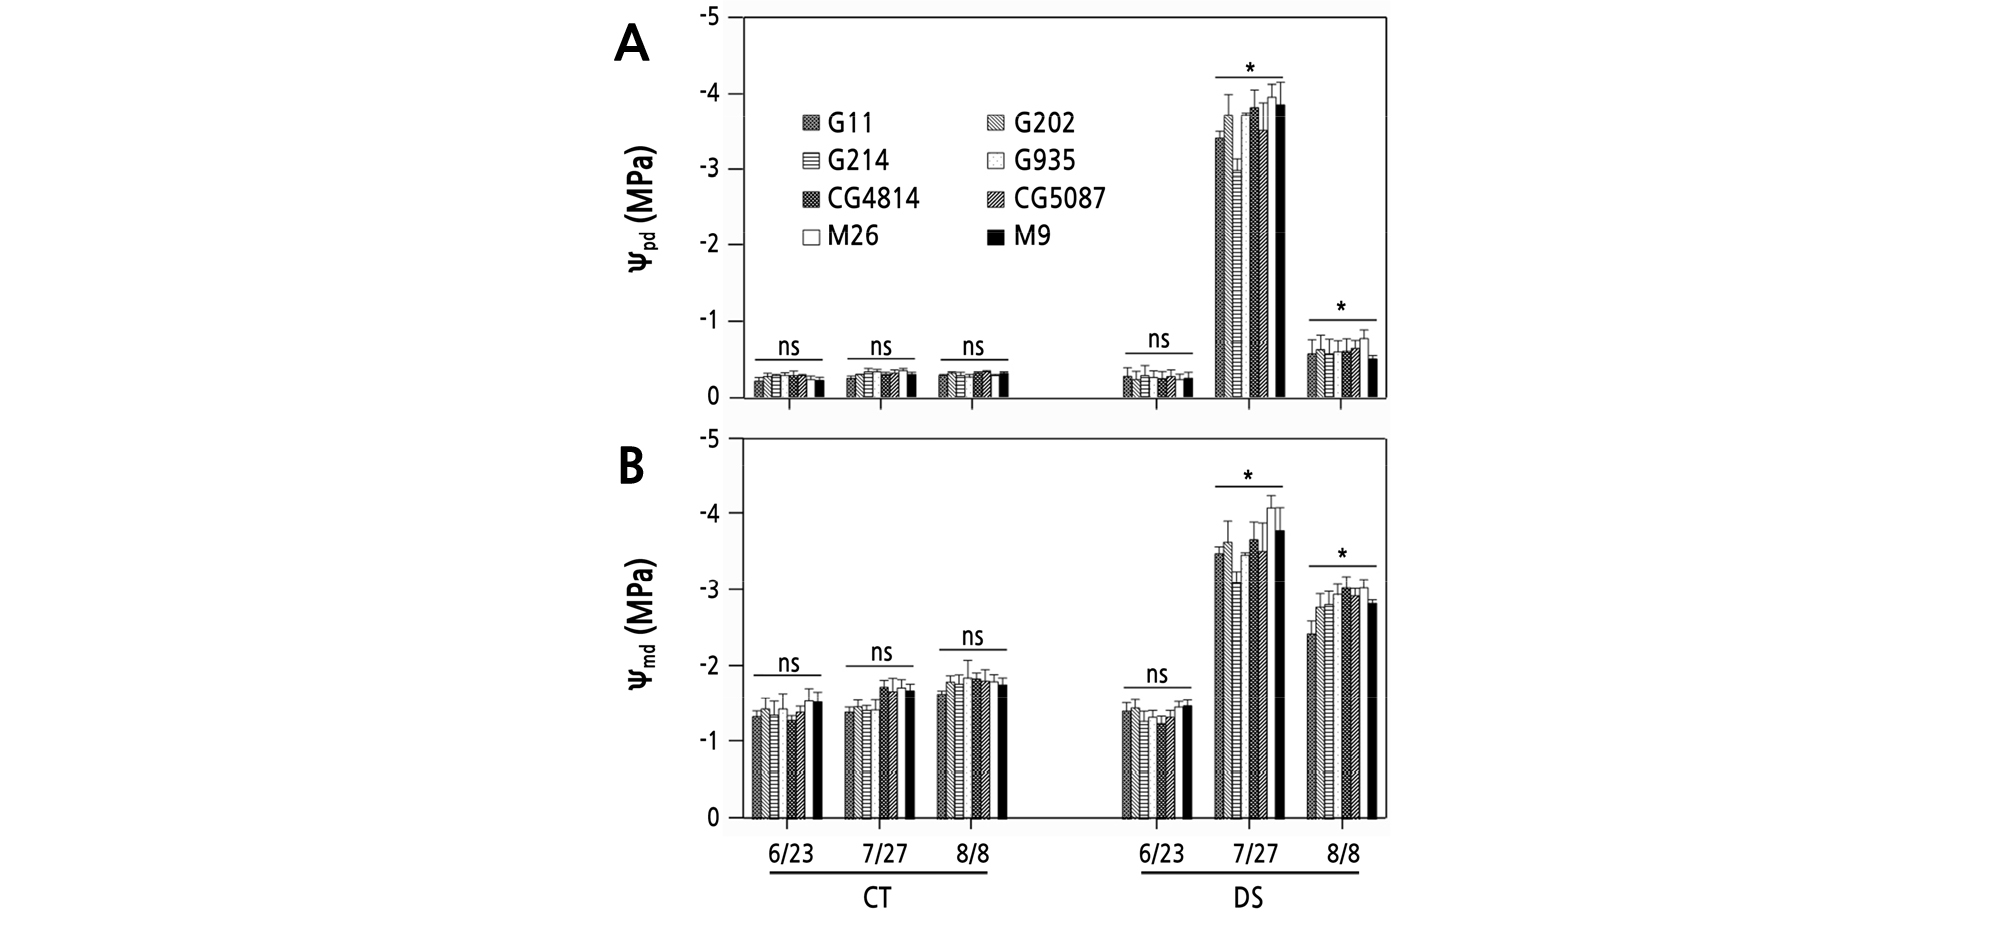
Fig. 3.
Changes in predawn (A) and midday (B) leaf water potential of 1-year-old ‘Fuji’ apple trees grafted on various rootstocks during the control (CT) and drought stress (DS) treatments on June 23 (before drought), July 27 (17th day after re-irrigation), and August 8 (11th day after the restart of irrigation in the same manner as the CT). Vertical bars represent the mean ± standard error. * significant at p < 0.05, ns: not significant.
Leaf Gas Exchange and Water-Use Efficiency (WUE)
During the treatment, Pn, Gs, and E showed a similar pattern in both CT and DS conditions. CT trees had a Pnrange of 9.0 to 14.7 µmol·m-2·s-1 for the entire period, with no noticeable difference among the rootstock types (Fig. 4). On June 23, before stress was initiated, the Pnrange of DS trees was 12.0 to 12.8 µmol·m-2·s-1, but on June 29, six days after the cessation of water supply, the Pnfor G11 and M9 was 5.1 and 5.0 µmol·m-2·s-1, respectively, and dropped to 3.6 µmol·m-2·s-1 for G935 and M26 trees. The Pnof DS trees recovered to the CT level on July 6, on the 2nd day since re-irrigation. On July 27, when the stress was at its peak, the Gswas 0.003 to 0.015 mol·H2O·m-2·s-1, and Pnwas very low, at 1.0 to 2.0 µmol·m-2·s-1. On August 8, the 11th day after the stress ended and sufficient watering began, the Pn of DS trees was highest in G11 (5.4 µmol·m-2·s-1) and lowest in CG5087 (3.5 µmol·m-2·s-1), but the differences between trees were not substantial. Under water-constrained environments, WUE variations tended to improve as stress increased (Fig. 4). The maximum WUE in DS trees was observed on July 27, with 3.8 µmol-1·mol-1 for M9 and G935, and 2.9 µmol-1·mol-1 for G11 and G202.
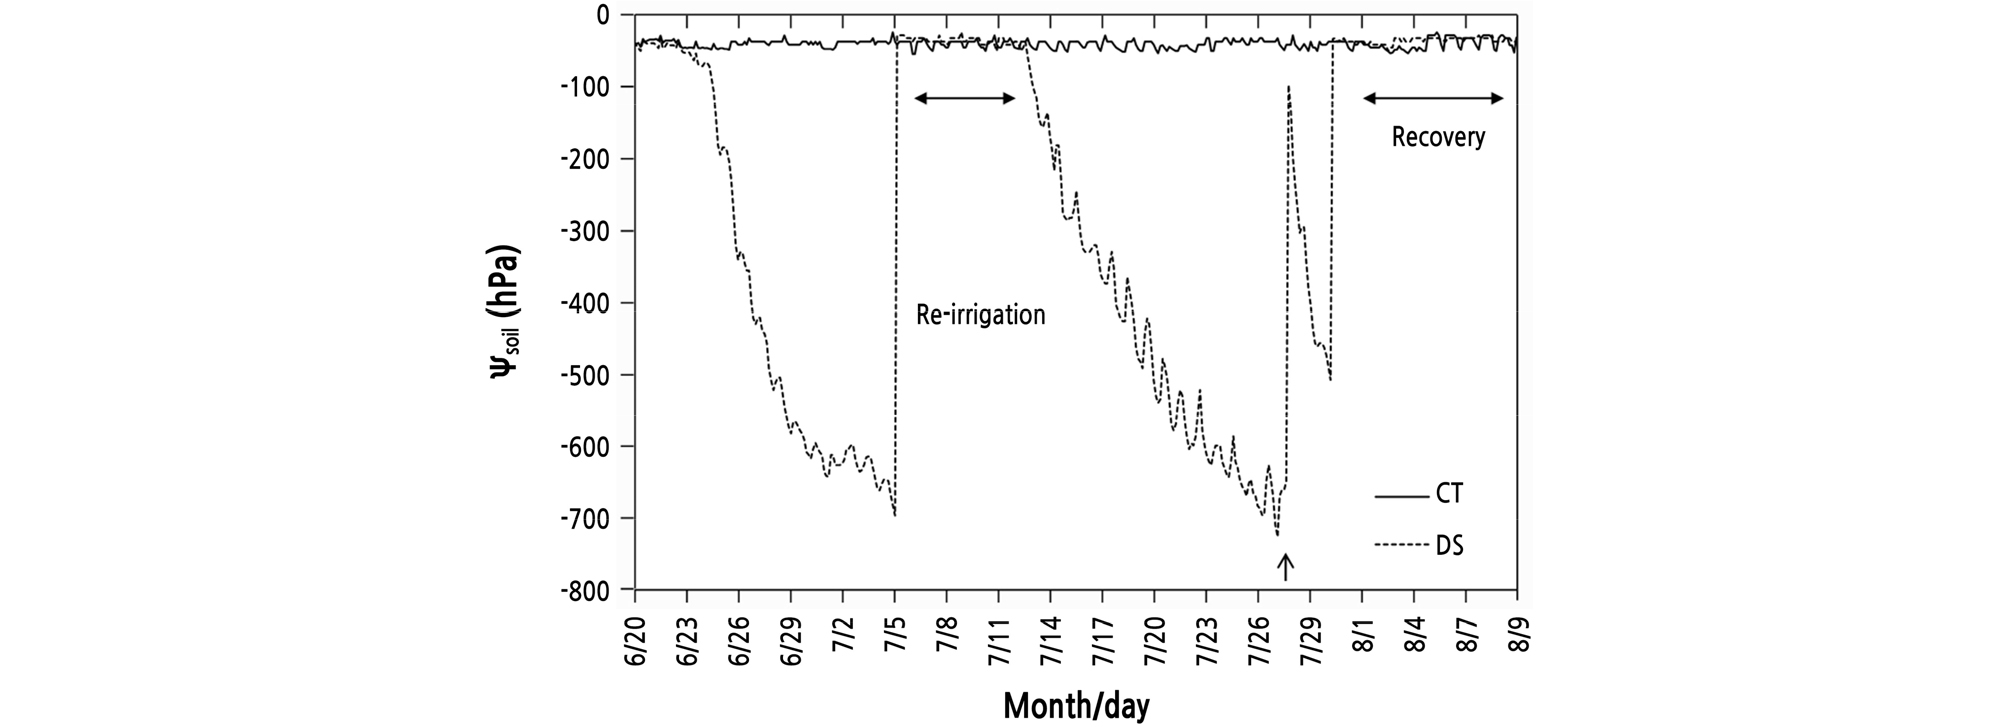
Fig. 4.
Changes in photosynthetic rate (Pn) (A1, A2), stomatal conductance (Gs) (B1, B2), transpiration (E ) (C1, C2), and water-use efficiency (WUE) (D1, D2) of ‘Fuji’ apple trees grafted on various rootstocks during the control (CT) and drought stress (DS) treatments. Vapor pressure deficit (VPD) between 11:00 and 15:00 h on the day indicated. Vertical bars represent the mean ± standard error. * significant at p < 0.05, ns: not significant.
Vegetative Growth and Dry Matter
Lack of soil moisture immediately affected the growth rate of tree height (Fig. 5). On June 29, six days after the water supply was restricted, M26 and G935 showed the largest vertical growth reductions, with RGR values of 40.8% and 44.4%, respectively. The vertical growth of all DS trees resumed after re-irrigation began on July 5, but after July 12, because of the suspension of irrigation, the vertical growth of all DS trees reduced again. Under DS, the RGR of G214 was 38.4% on July 21, and the RGR of M26 was only 18.9%. On July 27, when the stress almost reached its peak, all trees stopped growing, and from July 29, tree growth tended to recover slightly after irrigation commenced.
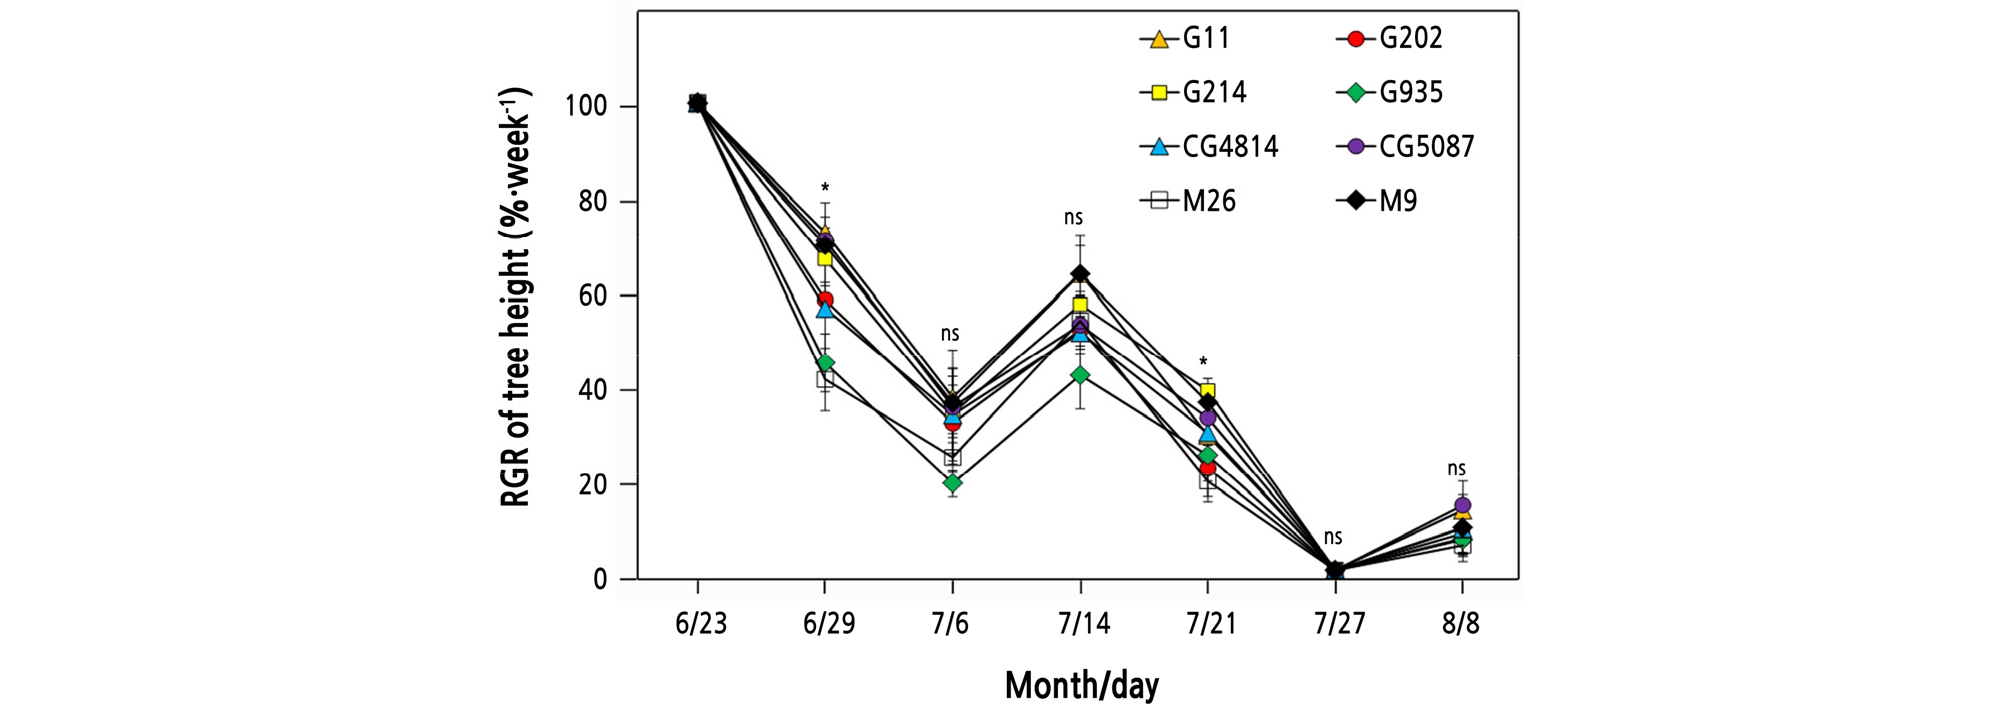
Fig. 5.
Changes in the relative growth rate of tree height (RGR of tree height = weekly growth in drought stress / weekly growth in the control treatment) of ‘Fuji’ apple trees subjected to drought stress. Vertical bars represent the mean ± standard error. * significant at p < 0.05, ns: not significant.
The amount of vertical growth of CT trees during the 45-day treatment did not correspond to known rootstock vigor (Table 1). The G935 tree grew 81 cm, but M26, known as a semi-dwarfing rootstock, was the smallest at 73 cm. In DS, however, the vertical growth of G935 was 18.6 cm, showing a greater growth reduction compared with the other trees. G202 and M26 produced shoot dry weights of 44.5 and 43.5 g in the CT, respectively, but M9 was 31.7 g. The extent of reduction in shoot dry weight of DS trees ranged from 45% to 49%, and the difference between rootstock types was not large. The reduction rate of leaf dry weight in DS trees was similar to that of shoot dry weight. In DS trees, leaf area was highest for the G202 (2497 cm2) and M26 trees (2528 cm2), which produced the highest shoot dry weight, and smallest for the CG4814 tree (2186 cm2) (Table 1). Overall, the greater reduction rate of leaf area in DS trees compared with the leaf dry weight might be explained by the exclusion of leaves less than about 2 cm2 that were difficult to measure (Table 1).
Table 1.
Amount of vertical growth from June 23 to August 8, 2017, and shoot dry weight, leaf dry weight, and leaf area at the end of the experiment
The coarse root dry matter production of each tree during the entire experiment, approximately 5 months, differed between several rootstock types in both CT and DS conditions (Table 2). The difference in coarse root development between trees of G or CG and M series appeared to be a result of the rootstocks’ characteristics. In the CT, the coarse root dry weight was 2.07 g for the CG4814 tree, but only 0.19 g for the M9 tree. This trend was similar in the DS treatment, with a higher coarse dry weight recorded for the CG4814 tree (1.58 g) than the M9 tree (0.15 g). The G202 and M26 trees grew relatively vigorously in the CT, producing 8.17 and 7.63 g fine root dry weight, respectively. The CG5087 tree had a 58% fine root growth rate in DS compared with the CT. Meanwhile, the smallest reduction was 2% for the G935 tree and, correspondingly, 14% for the G214 tree. The difference in the root:shoot ratio among the trees was more evident under DS than in the CT. The root:shoot ratio of all trees in the CT condition ranged from 0.16 to 0.23. However, the root:shoot range of DS trees was 0.30 ‑ 0.38 for G11, G202, G214, G935, and CG4814, and 0.27, 0.24, and 0.23 for M9, CG5087, and M26, respectively. During DS, the range of increase or decrease in the TCA of the scion of both treatments (CT and DS) tended to be similar to the range of increase or decrease in shoot dry weight or leaf dry weight (Table 2). In the CT, the TCA change increased most for the M26 (31.2 mm2) and G202 trees (31.0 mm2), and least for G935 (23.2 mm2), G11 (23.3 mm2), and CG5087 (23.3 mm2). In DS, the TCA increase was 46% for the M26 tree and 52% for the G935 tree, and there was no considerable difference among trees compared with the same trees under the CT.
Table 2.
Coarse (>2 mm diameter) and fine (< 2 mm diameter) root dry matter, root:shoot ratio (root/shoot biomass) at the end of the experiment, and increase in trunk cross-sectional area (TCA) of the scion from June 23 to August 8, 2017
Discussion
Leaf Water Potential (Ѱleaf) and Evapotranspiration
The Ѱleaf has been chosen as an indicator to determine whether a plant is under water stress. Wang and Stutte (1992) reported that apple trees are unable to maintain leaf turgor potential through osmotic adjustment when Ѱleaf falls below ‑ 1.6 MPa, and mature leaves begin to wither when Ѱleaf falls below ‑ 2.5 MPa. On July 27, at the peak of the DS, the Ѱleaf of all DS trees fell below the wilting point both at predawn and midday (Fig. 3). At the end of the recovery period, on August 8, the Ѱsoil of trees under DS was restored to the CT level (Fig. 1), yet the Ѱleaf of DS trees was still greatly different from that of CT trees. These results indicate that although DS has been removed, functional failures remained in the water-conducting system. Severe drought could cause xylem cavitation in the stem, and if the cavitation spread throughout the plant, it would take time to rehydrate (Sparks and Black, 1999; Blackman et al., 2009).
The daily amount of evapotranspiration seems to be closely related to the amount of water loss through the soil ‑ plant ‑ air continuum caused by the vapor pressure deficit (VPD) (Fig. 2). Trees in the DS treatment received sufficient irrigation (from July 5 to July 11), but the amount of evapotranspiration was markedly higher in CT than in DS conditions. The difference was more apparent on days with a high VPD. The consistently low amount of evapotranspiration of the CG4814 tree in the CT is probably associated with the leaf area produced by the tree. In the DS treatment, the evapotranspiration was somewhat lower in the G935 tree than in the other trees, but there was no consistent tendency. Given that the Pn of DS trees measured on July 6 did not differ noticeably from the CT level after re-irrigation, it suggests that the tree’s ability to absorb water was still close to the CT level, even if exposed to water stress for 11 days.
Photosynthesis and Related Parameters
In this study, there was no noticeable difference in Gs among DS or CT trees throughout the treatment period (Fig. 4), but there was a similar pattern of change between Pn and Gs. Plants effectively cope with water deficit by inducing a loss of turgor of guard cells, which causes stomatal pore closure (Giorio et al., 1999), but drought persistence and severity could be an important factor affecting the Pncapacity of trees. The Ѱsoil was similar ( ‑ 549 to ‑ 590 and ‑ 520 to ‑ 598 hPa, respectively) on June 29 and July 21 from 09:00 to 15:00 h. On June 29, however, the minimum Pnof DS trees that experienced 6 days of water stress was 3.6 µmol·m-2·s-1 (for G935 or M26), and the maximum was 5.2 µmol·m-2·s-1 (for G11). However, after encountering 10 days of water stress since re-irrigation on July 21, Pn decreased dramatically to 1.1 µmol·m-2·s-1 for the M9 tree and 2.0 µmol·m-2·s-1 for the G214 tree (Fig. 4). Decreased photosynthesis in the early stage of water stress is dominantly affected by stomatal pore closure, but chlorophyll loss is considered to be relevant when the stress period is extended (Guerfel et al., 2009). On August 8, although the trees in the DS treatment had received sufficient watering for about 11 days after cessation of DS, photosynthesis of all trees, including the G11 or M9 trees (p < 0.05), did not recover to the CT level. Nilsen and Orcutt (1996) and Miyashita et al. (2005) stated that severely water-stressed plants might fail to recover photosynthesis to the control level after re-irrigation because of abnormalities in the internal structure of chloroplasts and changes in the growth hormone content in leaves.
The WUE can be defined as moles of net CO2 uptake (Pn) per mole of H2O loss (E) (Kramer, 1983a). Serra et al. (2014) suggested that drought tolerance could improve the WUE and survival rates of plants. During the DS treatment, the WUE change tended to increase as the water stress increased. On July 27, at the peak of water stress, the M9 and G935 trees had a 31% improvement in WUE over G11 or G202 trees. This change is associated with a further reduction in transpiration rather than increased photosynthesis (Fig. 4). At the same time, it might result in a reduced CO2 inflow into the leaves, potentially affecting the photosynthesis mechanism (Kwak et al., 2011).
Vegetative Growth and Dry Matter
As the ‘Fuji’ apple trees grafted onto various rootstocks were exposed to severe water stress, the RGR of tree height decreased rapidly (Fig. 5). The recovery of the RGR was slower after the second stress than after the first stress, suggesting that the effects of stress could persist even if the trees were re-irrigated for a relatively long duration. The RGR of G202, G935, and M26 trees, which produced a relatively large leaf area among the trees in the DS treatment (Table 1), tended to decrease further during the experiment. Considering that different root hydraulic conductance and leaf area can contribute to the E of plants (Rodríguez-Gamir et al., 2010), it is assumed that the G202, G935, and M26 trees in this study responded relatively sensitively to water deficit.
In plants with combined scion and rootstock, the scion growth could be affected by the type of rootstock, and drought tolerance might also be exhibited differently (Liu et al., 2012). Kramer (1983b) stated that a well-established root system, which extends vertically and horizontally, improves the ability of plants to cope with water absorption when the soil water supply is inadequate. If the plants could implement strategies to increase the supply of carbohydrates toward enhancing root growth under water deficit (Arbona et al., 2005; Brunner et al., 2015), the G935 tree (98% in the DS treatment compared with the CT), unlike the CG5087 tree (58% in the DS treatment compared with the CT), seems to have preferentially allocated dry matter to fine root growth rather than to shoot growth (Tables 1 and 2). Under favorable soil moisture conditions, however, the dry matter partitioning to the above-ground tissues appeared to be prominent in all trees (Table 2). The amount of vertical growth and shoot dry weight in CT and DS trees did not show a similar tendency, which may be attributed to the different numbers of lateral shoots that emerged and different lateral shoot lengths among trees (Table 1).
Plants avoid DS by modulating the root:shoot biomass ratio, and their allocation may vary depending on the rootstock type (Pedroso et al., 2014; Yıldırım et al., 2018). In this study, the increase in the root:shoot ratio of trees in the DS treatment seems to be explained by the decrease in above-ground growth rather than the increase in root growth (Tables 1 and 2). In contrast, the root:shoot ratio of trees, such as M26 (0.23) and M9 (0.27), were lower than those of G or CG series rootstocks, which probably reflects the varying ratios of coarse roots attached to the rootstocks before planting when comparing the rootstock series. Trees, such as G935 (98% in the DS treatment compared with the CT) and G214 (86% in the DS treatment compared with the CT) that show a relatively insensitive response to fine root growth reduction, might be expected to be drought-tolerant even under prolonged water supply restrictions (Conesa et al., 2016). Along with the G935 tree, G202 also exhibited the lowest leaf:fine root ratio, so this attribute is thought to contribute to reducing the impact of xylem embolism on stem water transport (Cochard et al., 1996) by reducing the demand for transpiration per unit root (Rodríguez-Gamir et al., 2010).
In conclusion, DS trees underwent dramatic changes in growth traits and physiological response following prolonged exposure to extreme soil water deficit. Under severe drought conditions, there was no meaningful difference in photosynthetic capacity among DS trees. However, the trees developed a drought avoidance mechanism that rapidly reduced above-ground growth as part of reducing the whole plant transpiration. Therefore, the strategy of increasing the root:shoot biomass ratio is expected to contribute to improving tree survival (Chaves et al., 2002). Based on all tree growth and physiologic findings, our study showed that the CG5087 tree was the most sensitive to DS. Meanwhile, drought tolerance was higher in the G202, G214, and G935 trees relative to the M26 tree, which showed a comparable drought tolerance to the G11, CG4814, and M9 trees.
